

Some Graphs: Week 3
These are a bunch of graphs that I'll be sharing on a weekly basis

While I’ve spent much of my time developing my new regular season snap count graphs, I’m going to try to start doing regular drops of some of my favorite weekly graphs. I might add or remove items as I’m finding my groove with this, so bear with me and don’t hesitate to weigh in on things you’d like me to cover!
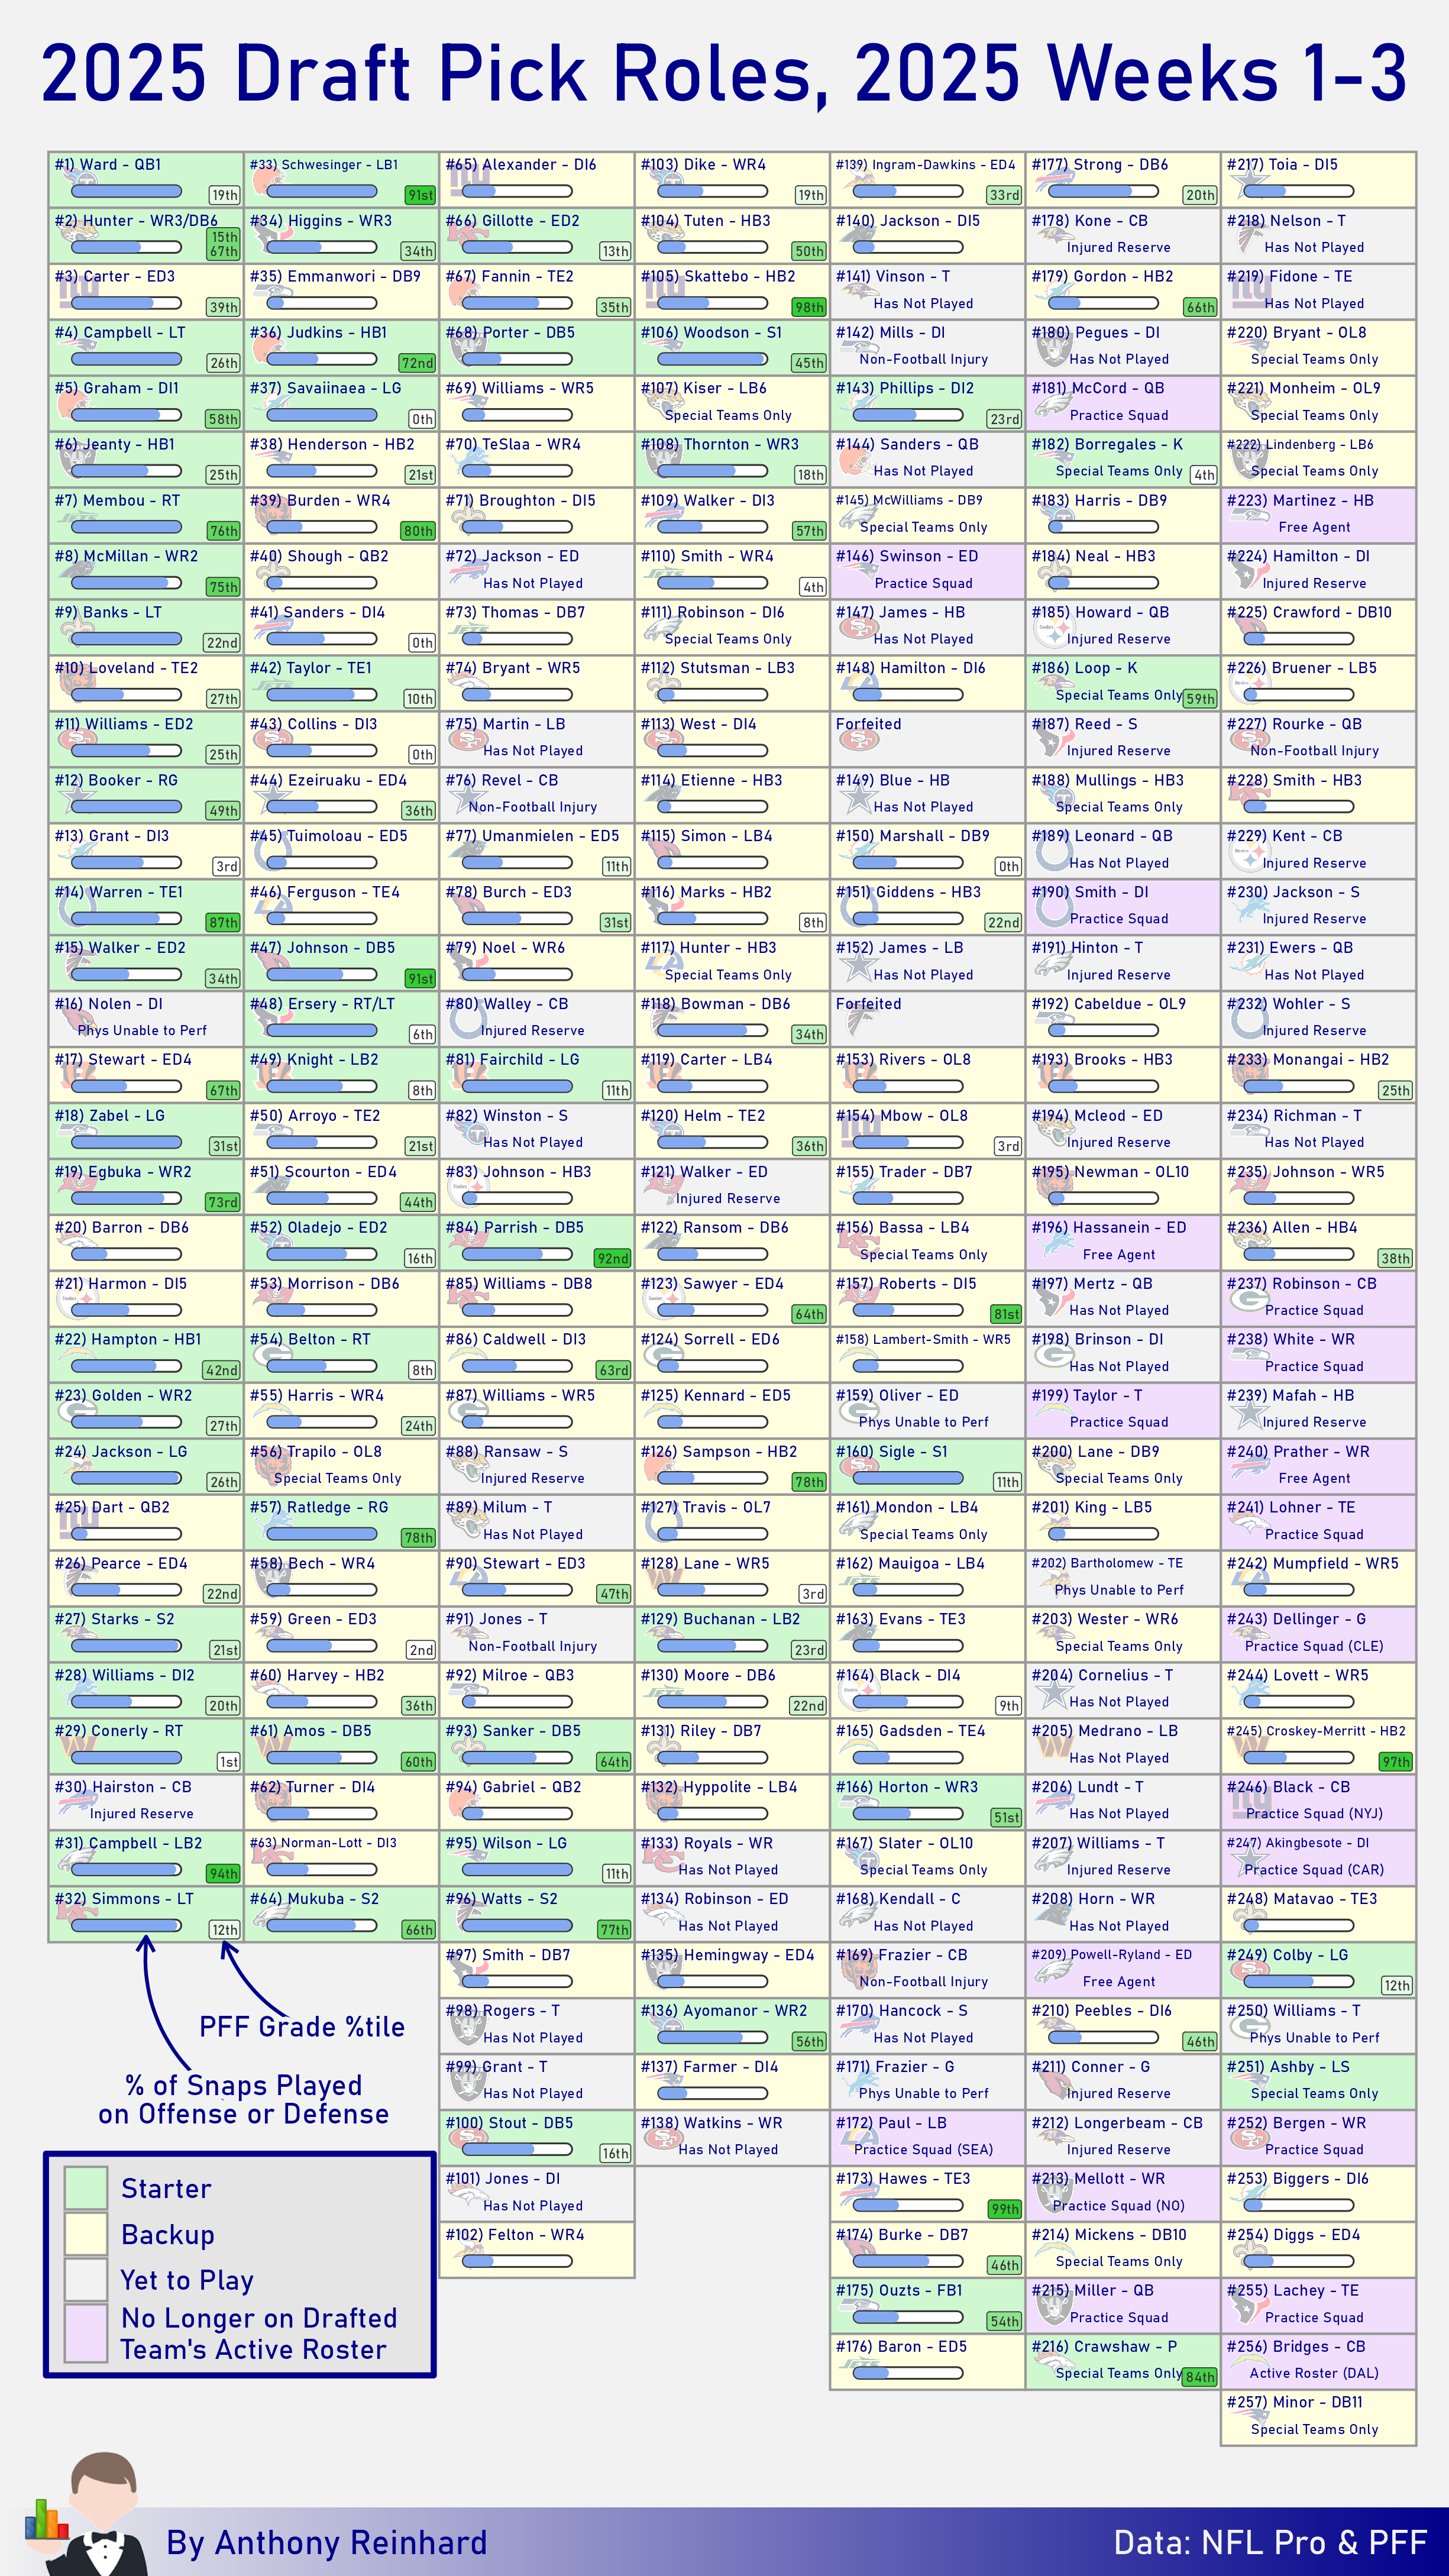
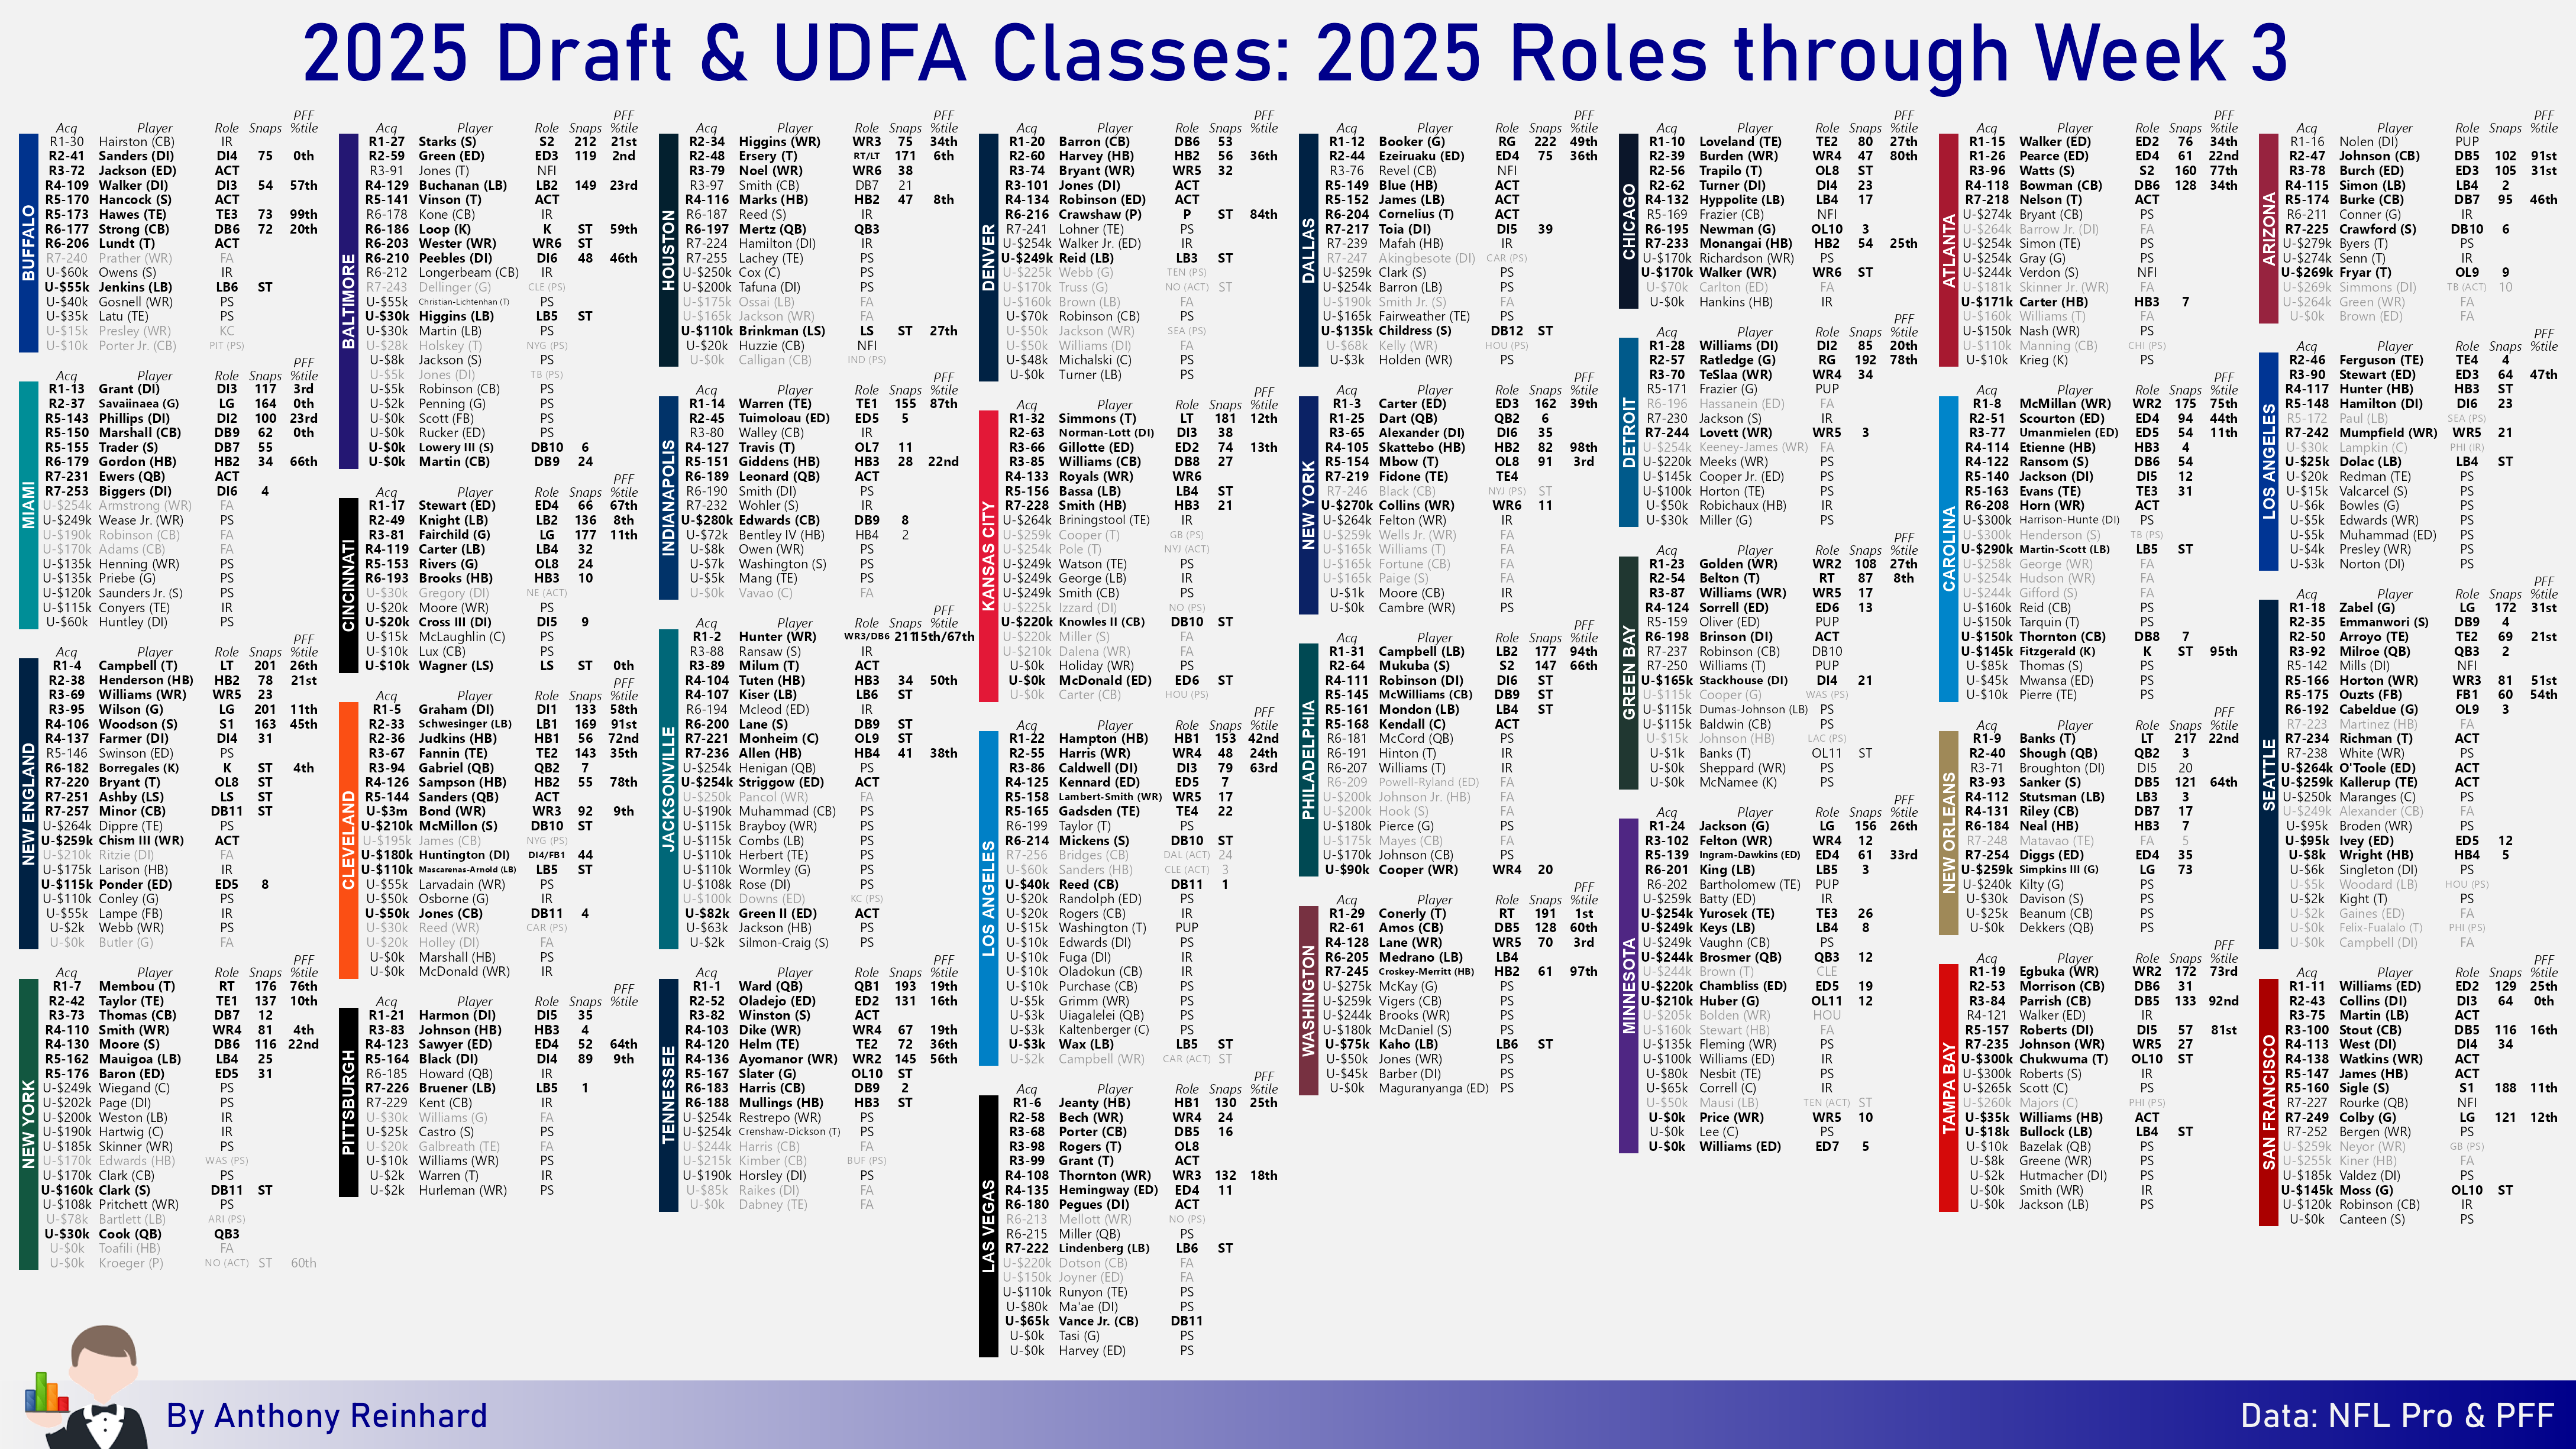
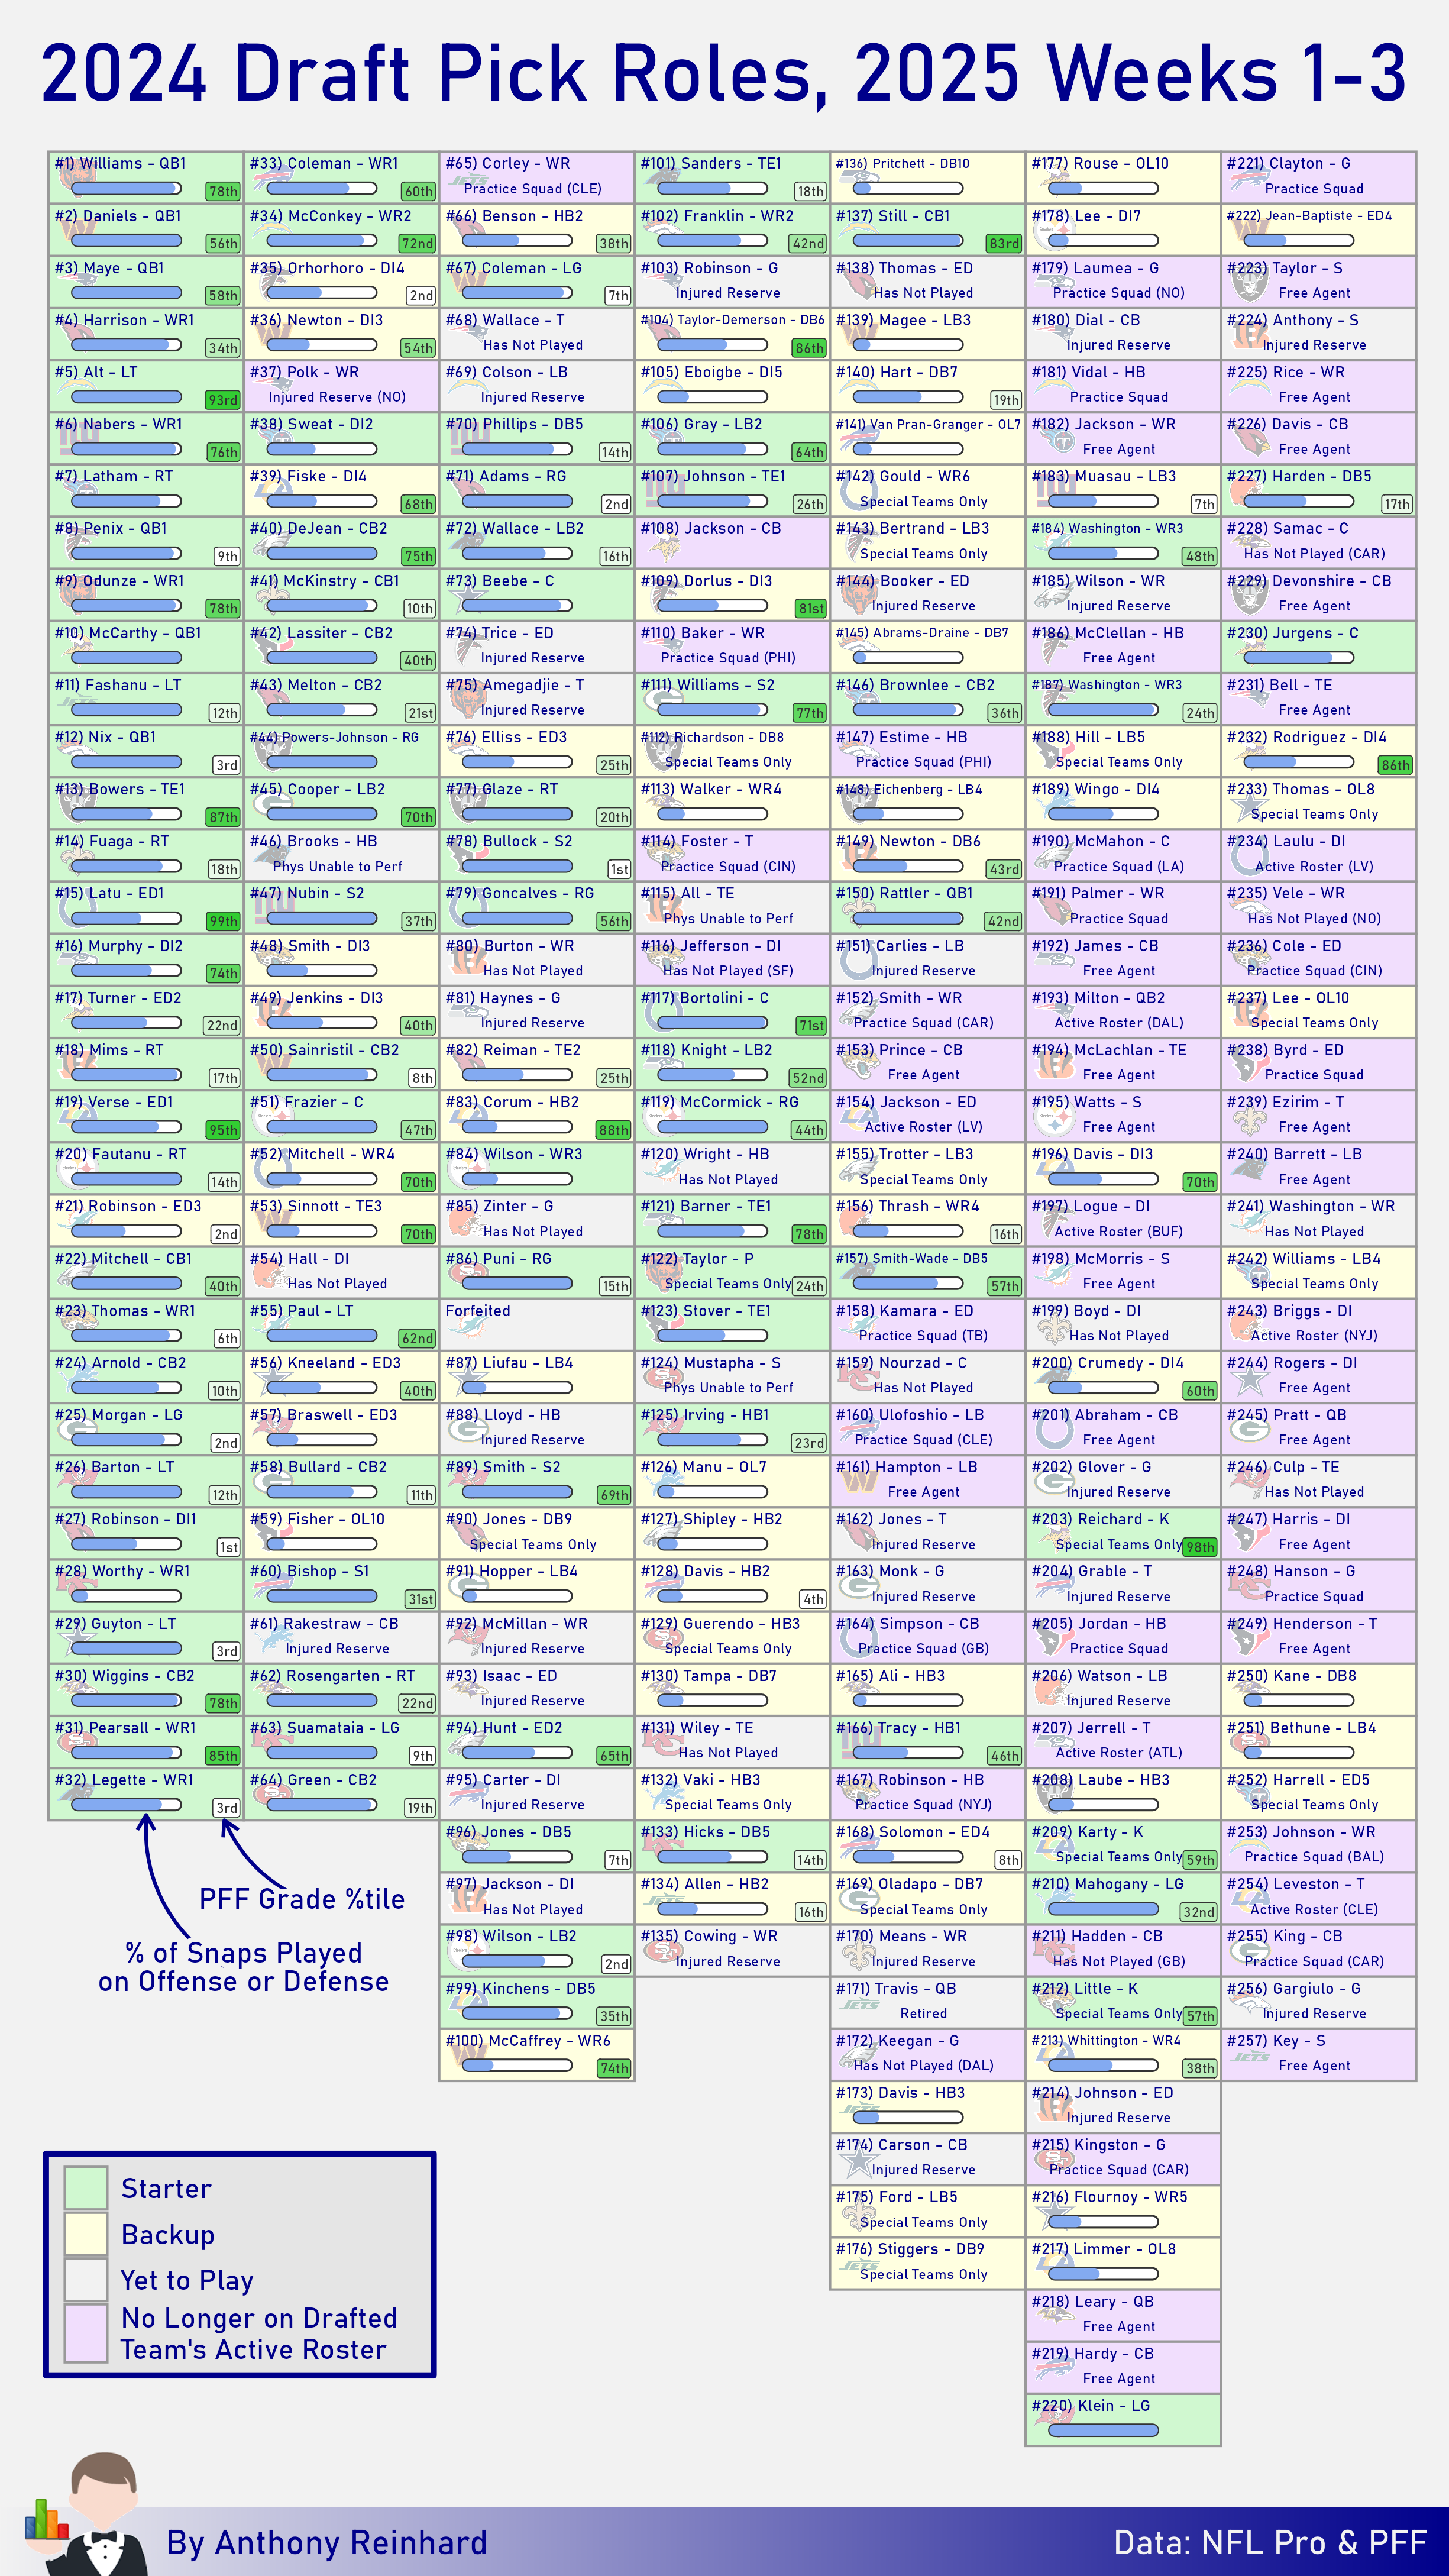
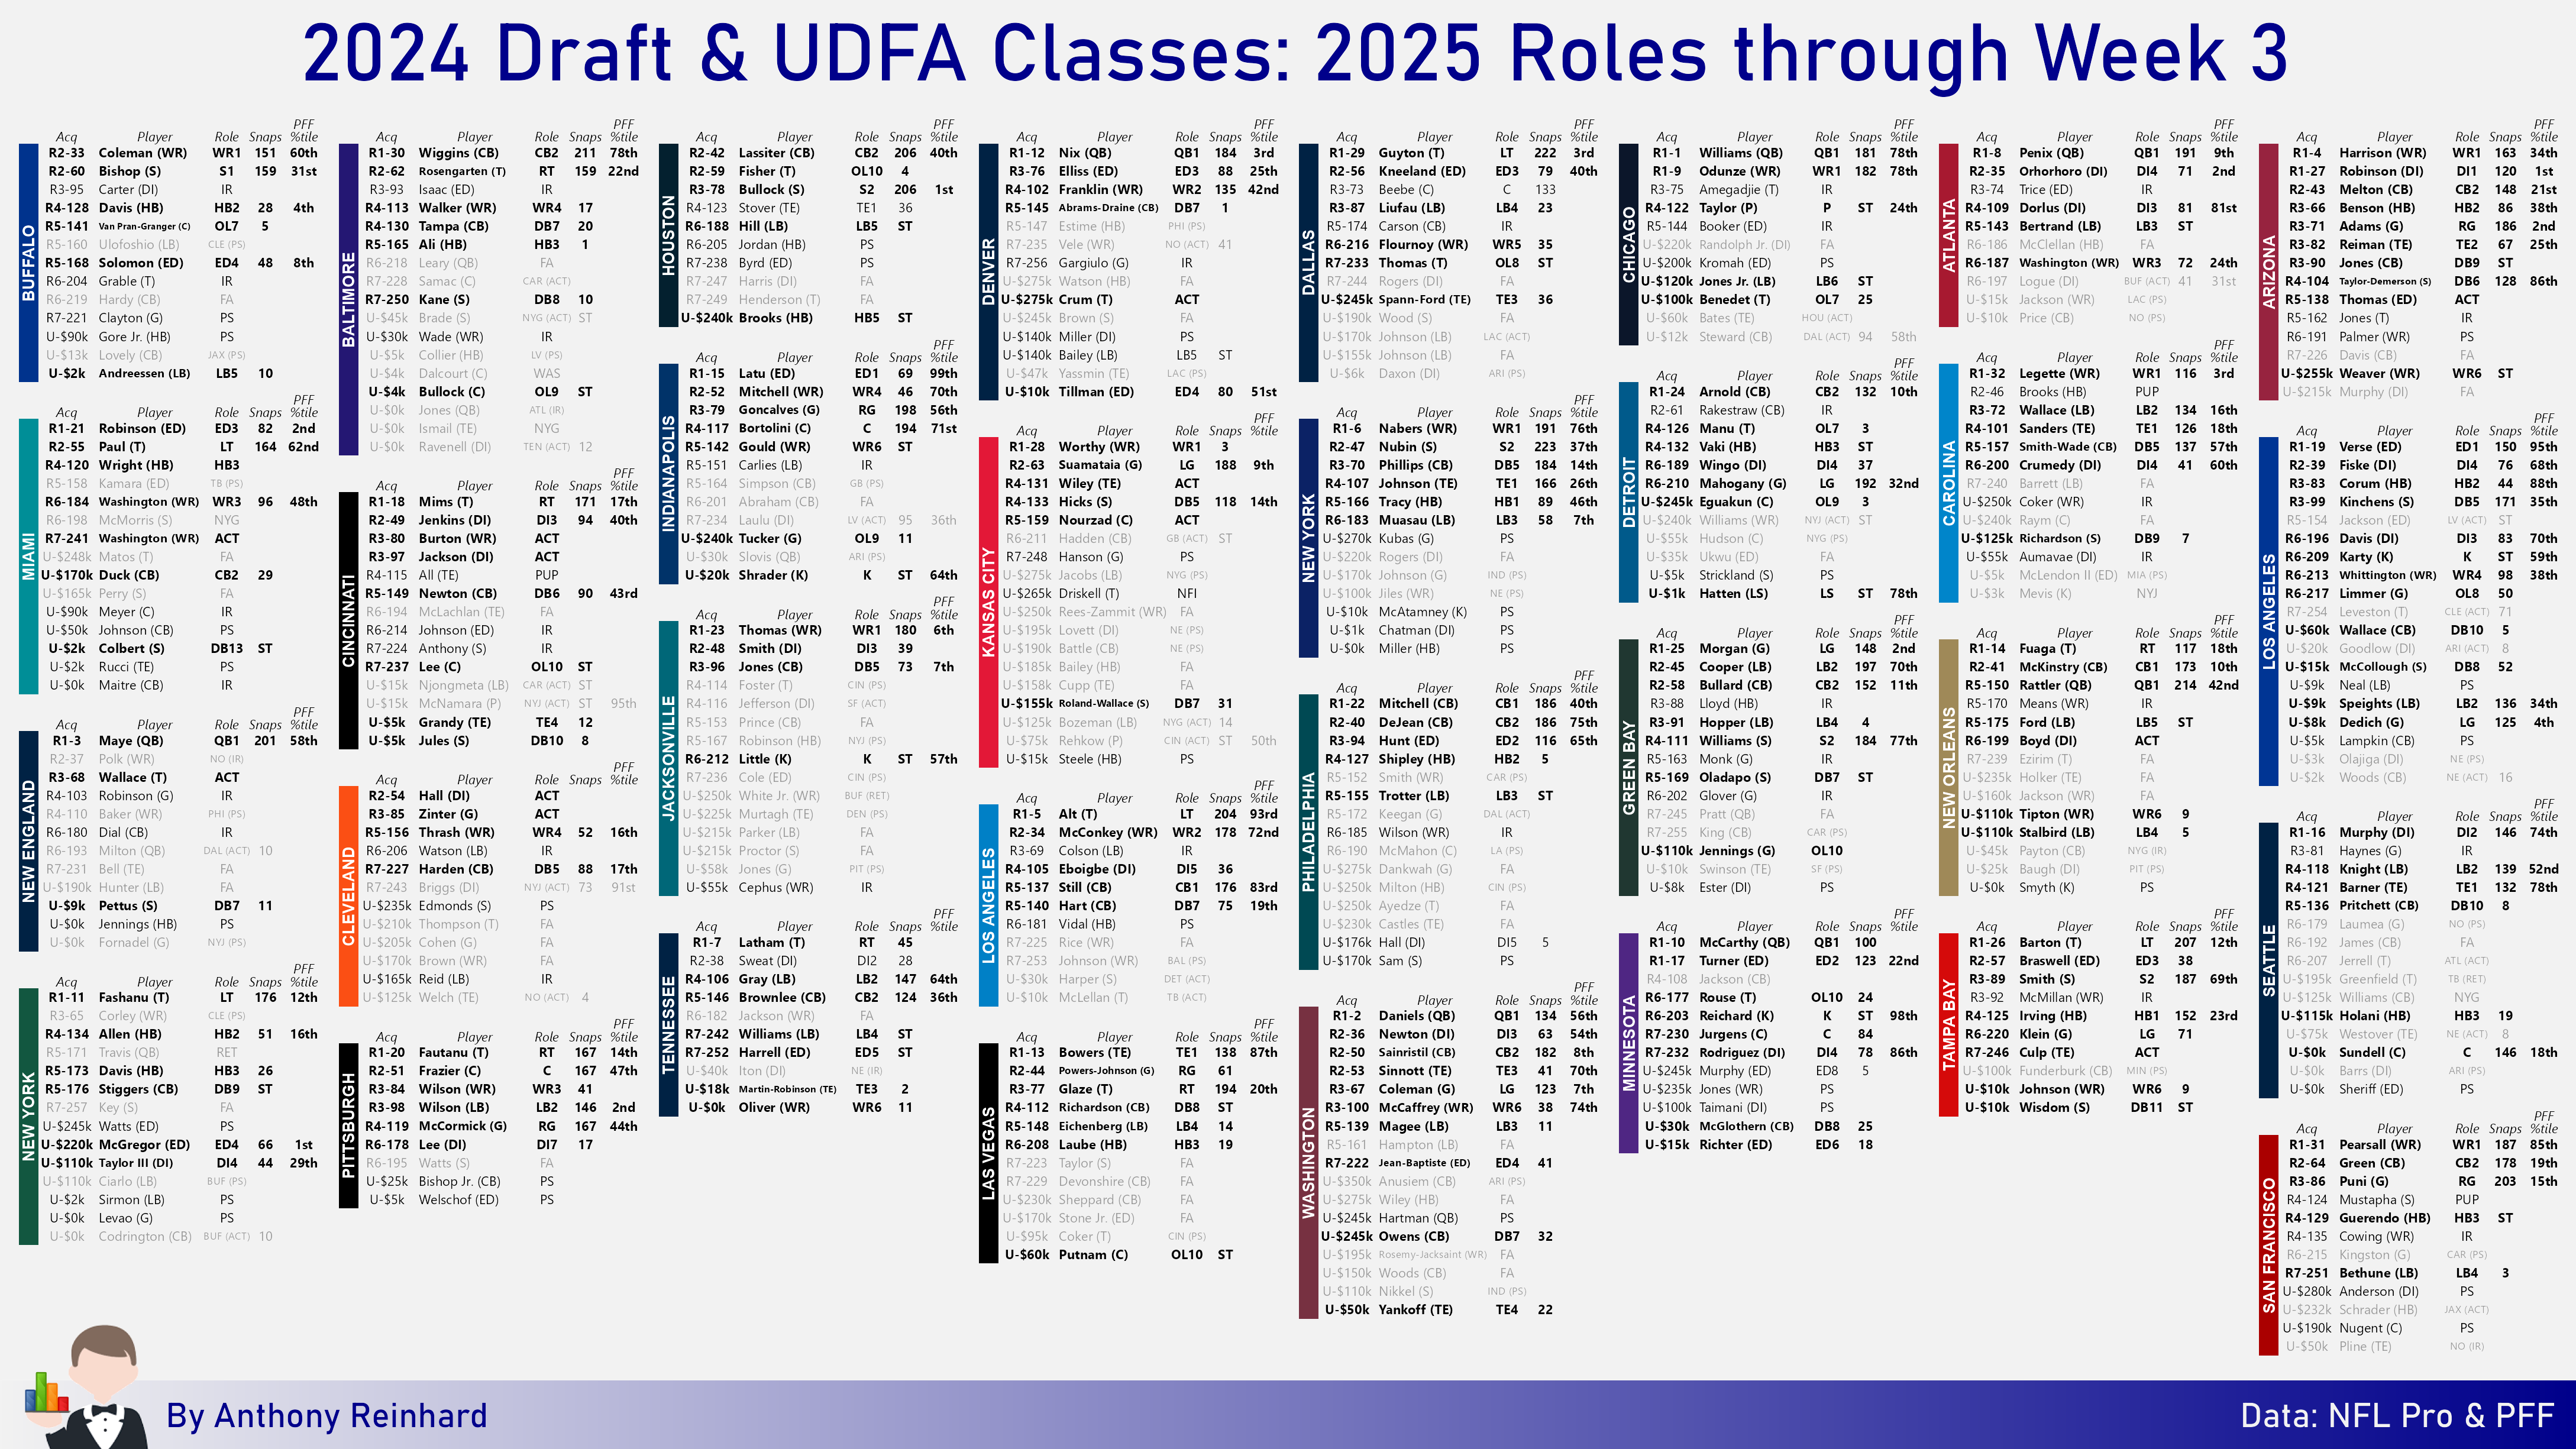
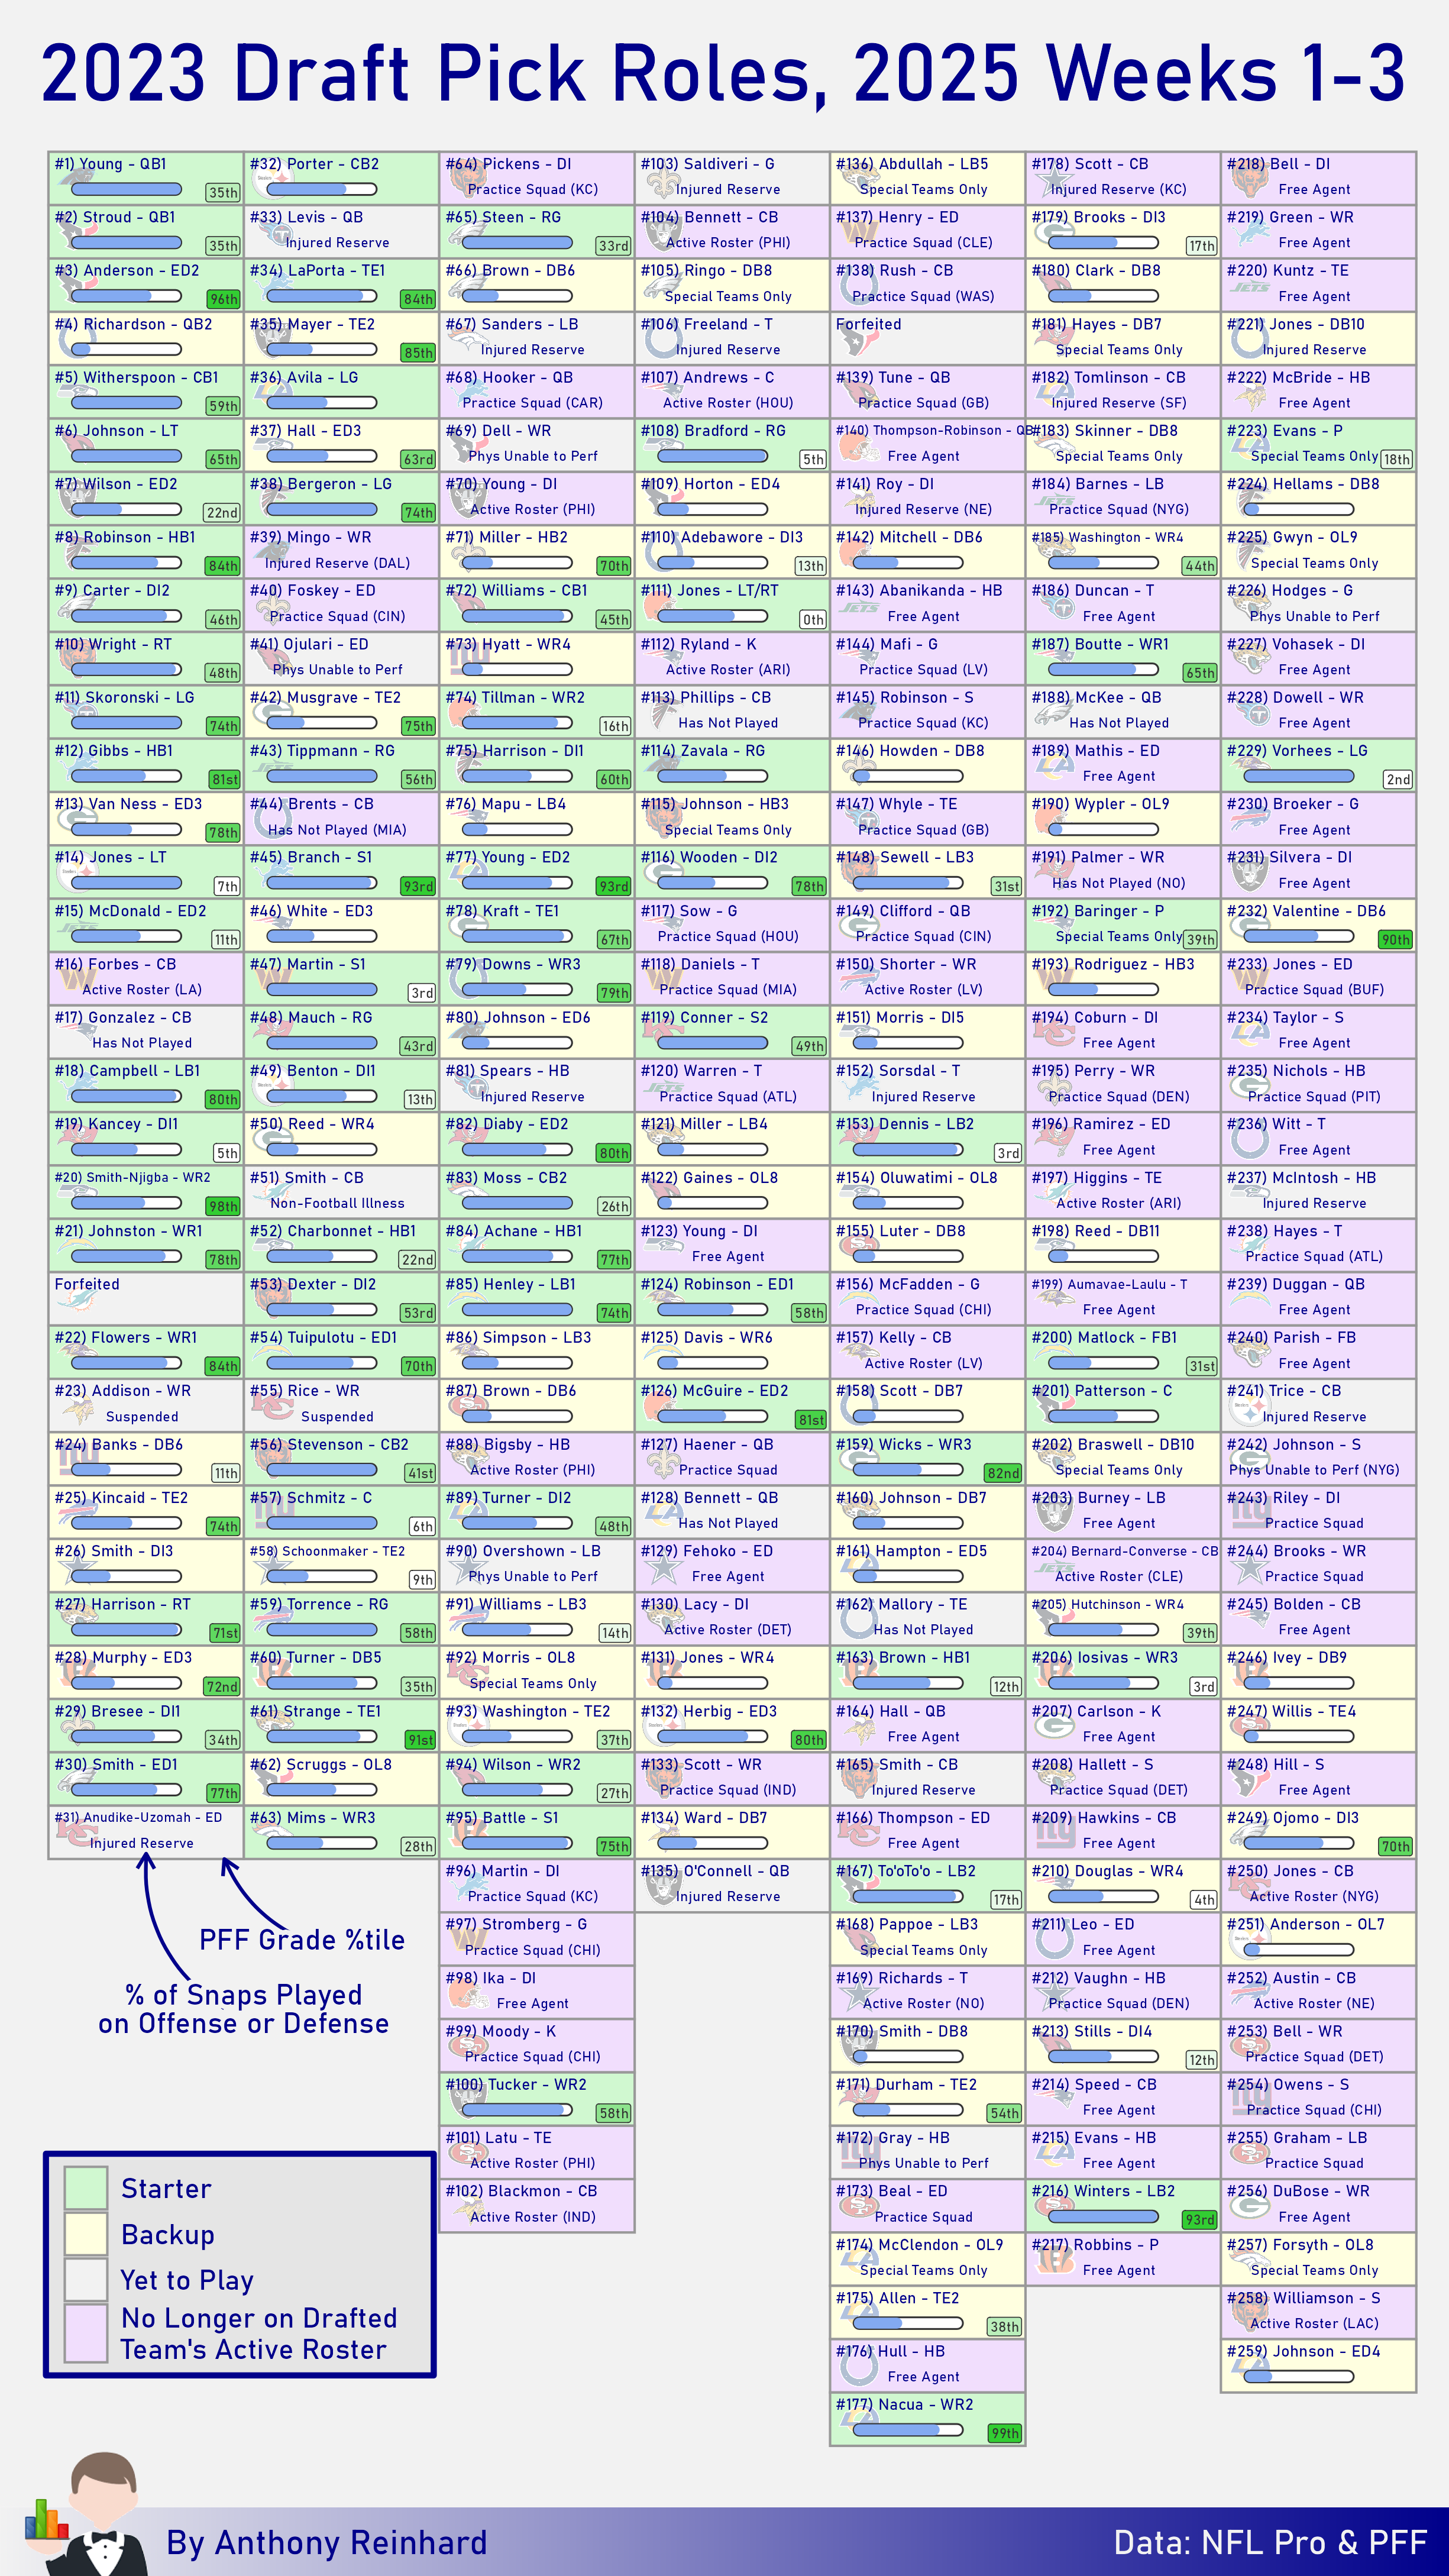
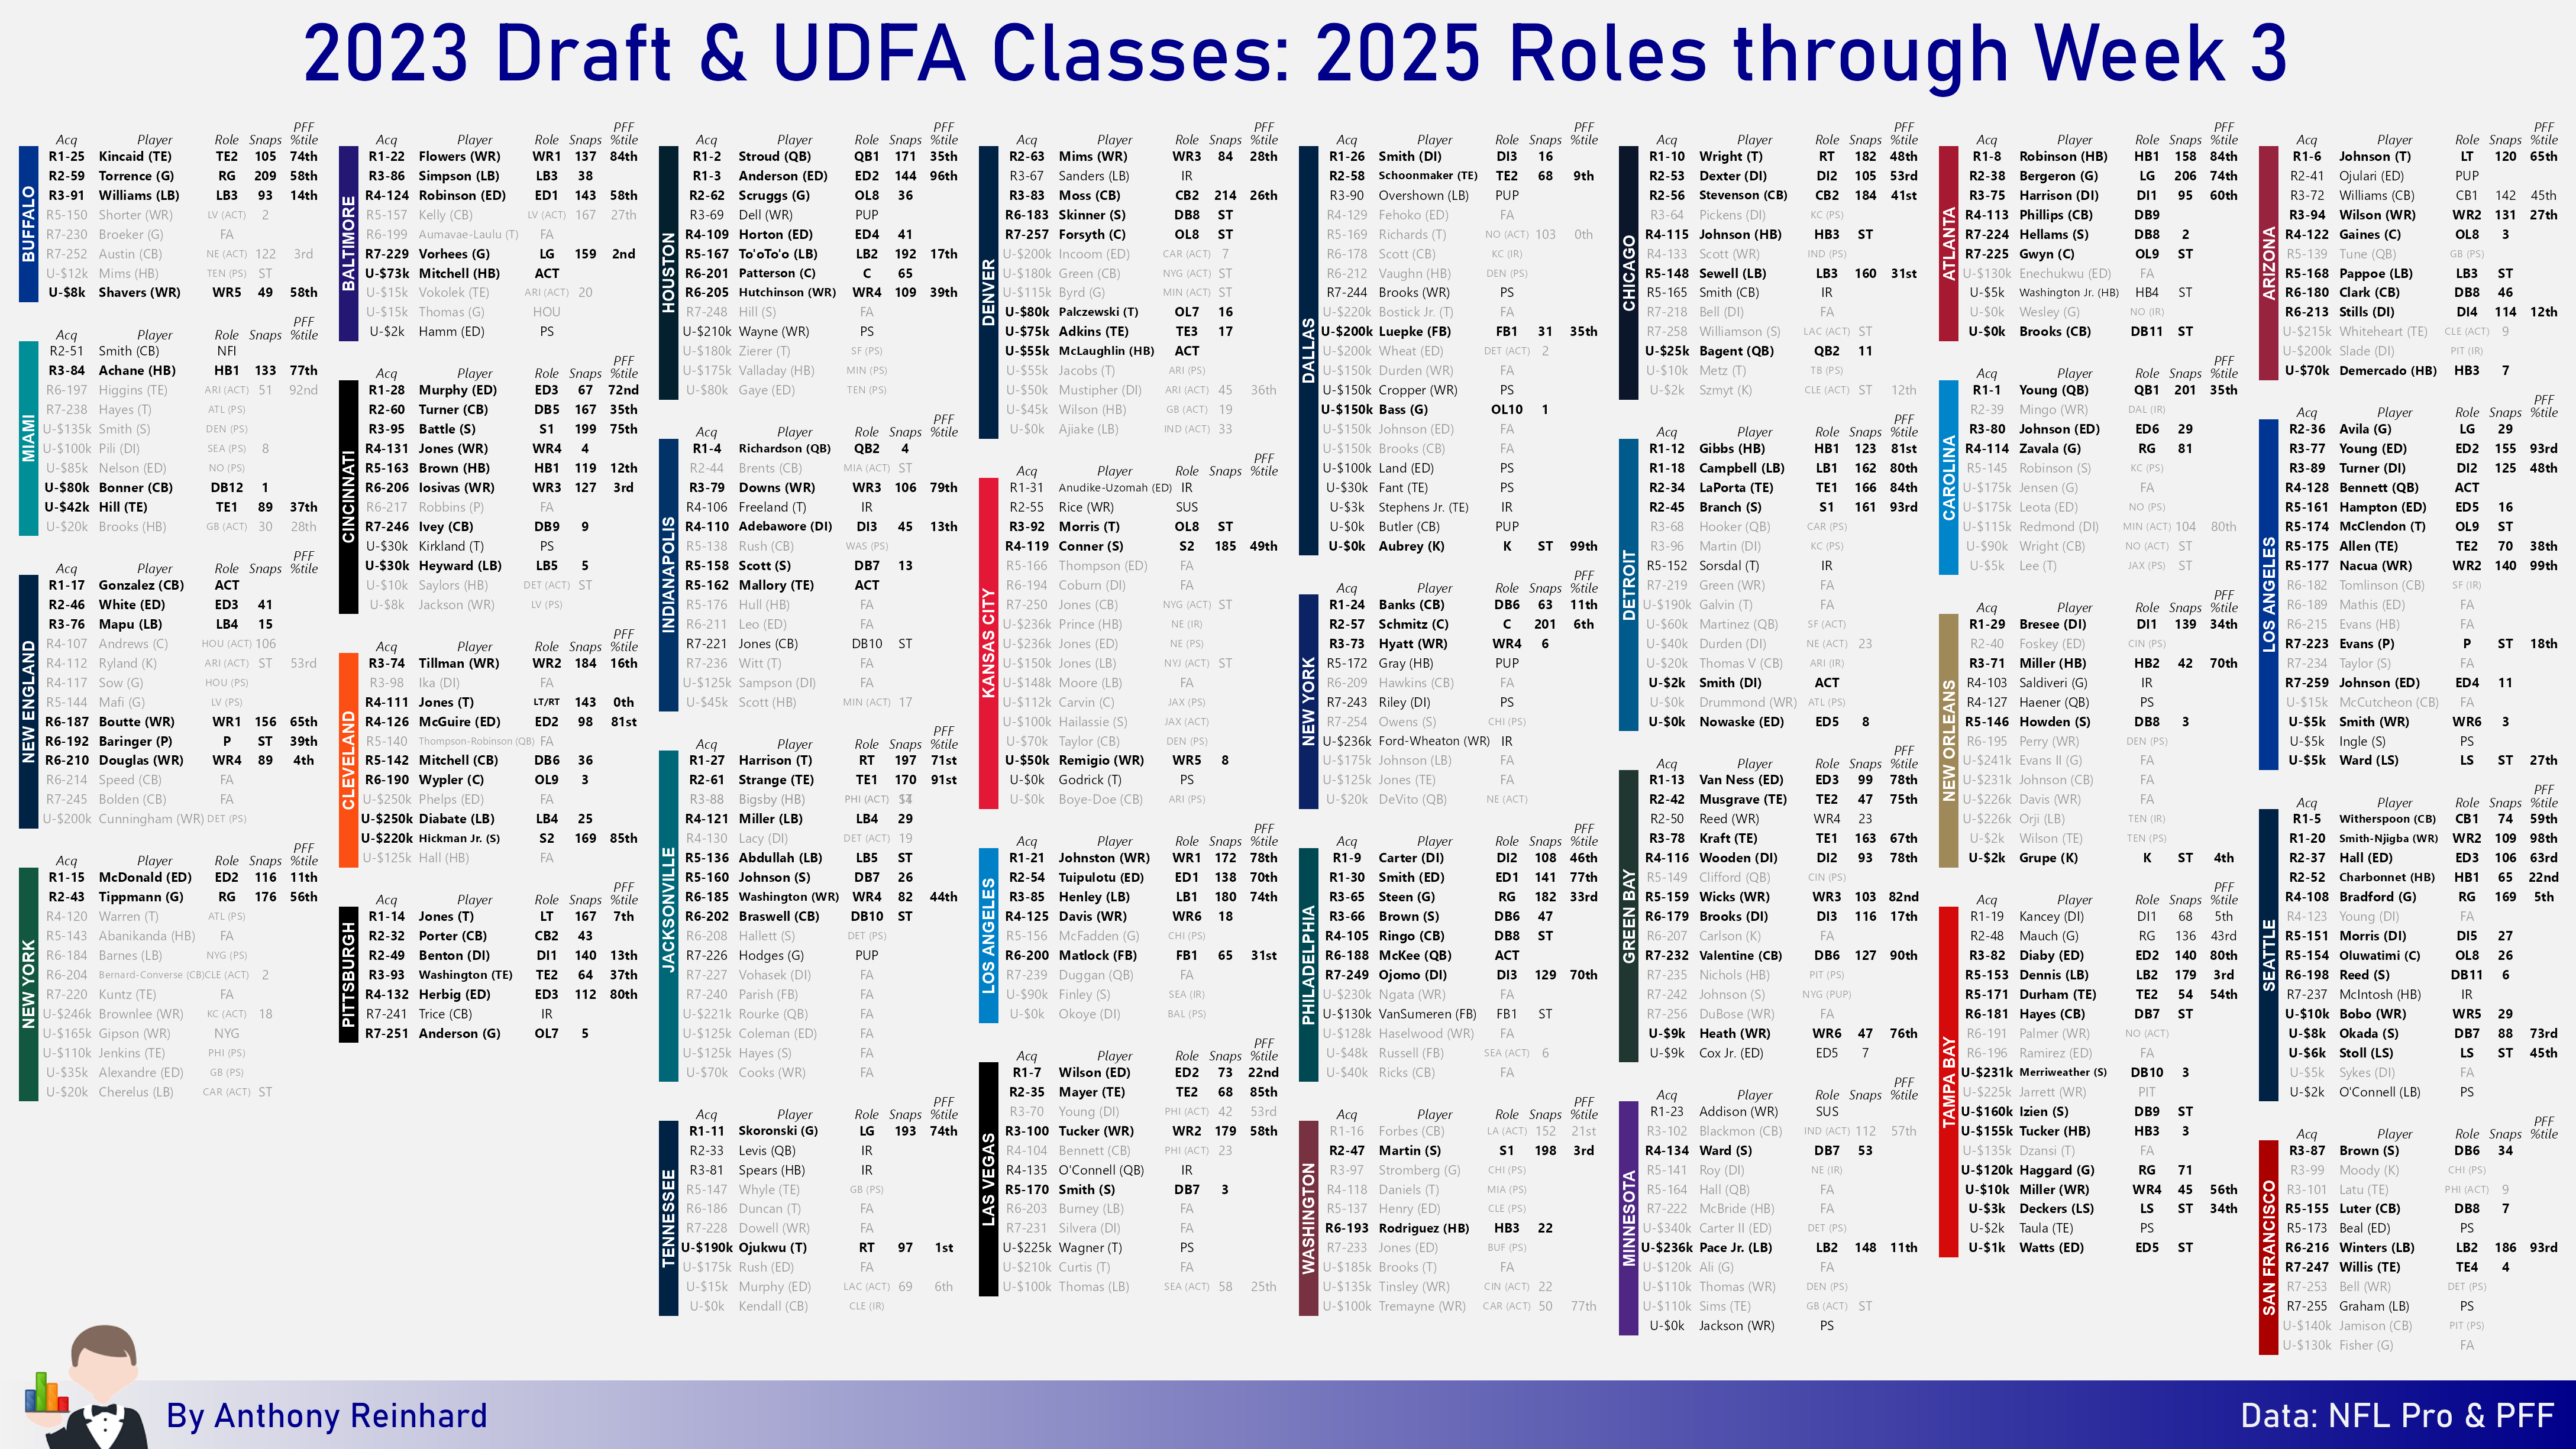
Draft Class Roles
These have been popular on social media when I shared them, so they’ll likely be a fixture of this weekly post. I’ve been sharing just the 2025 classes so far, but I’m going to share roles for the 2023 & 2024 classes on here. For those classes, I’m only showing their roles/grades/snaps from the 2025 season.
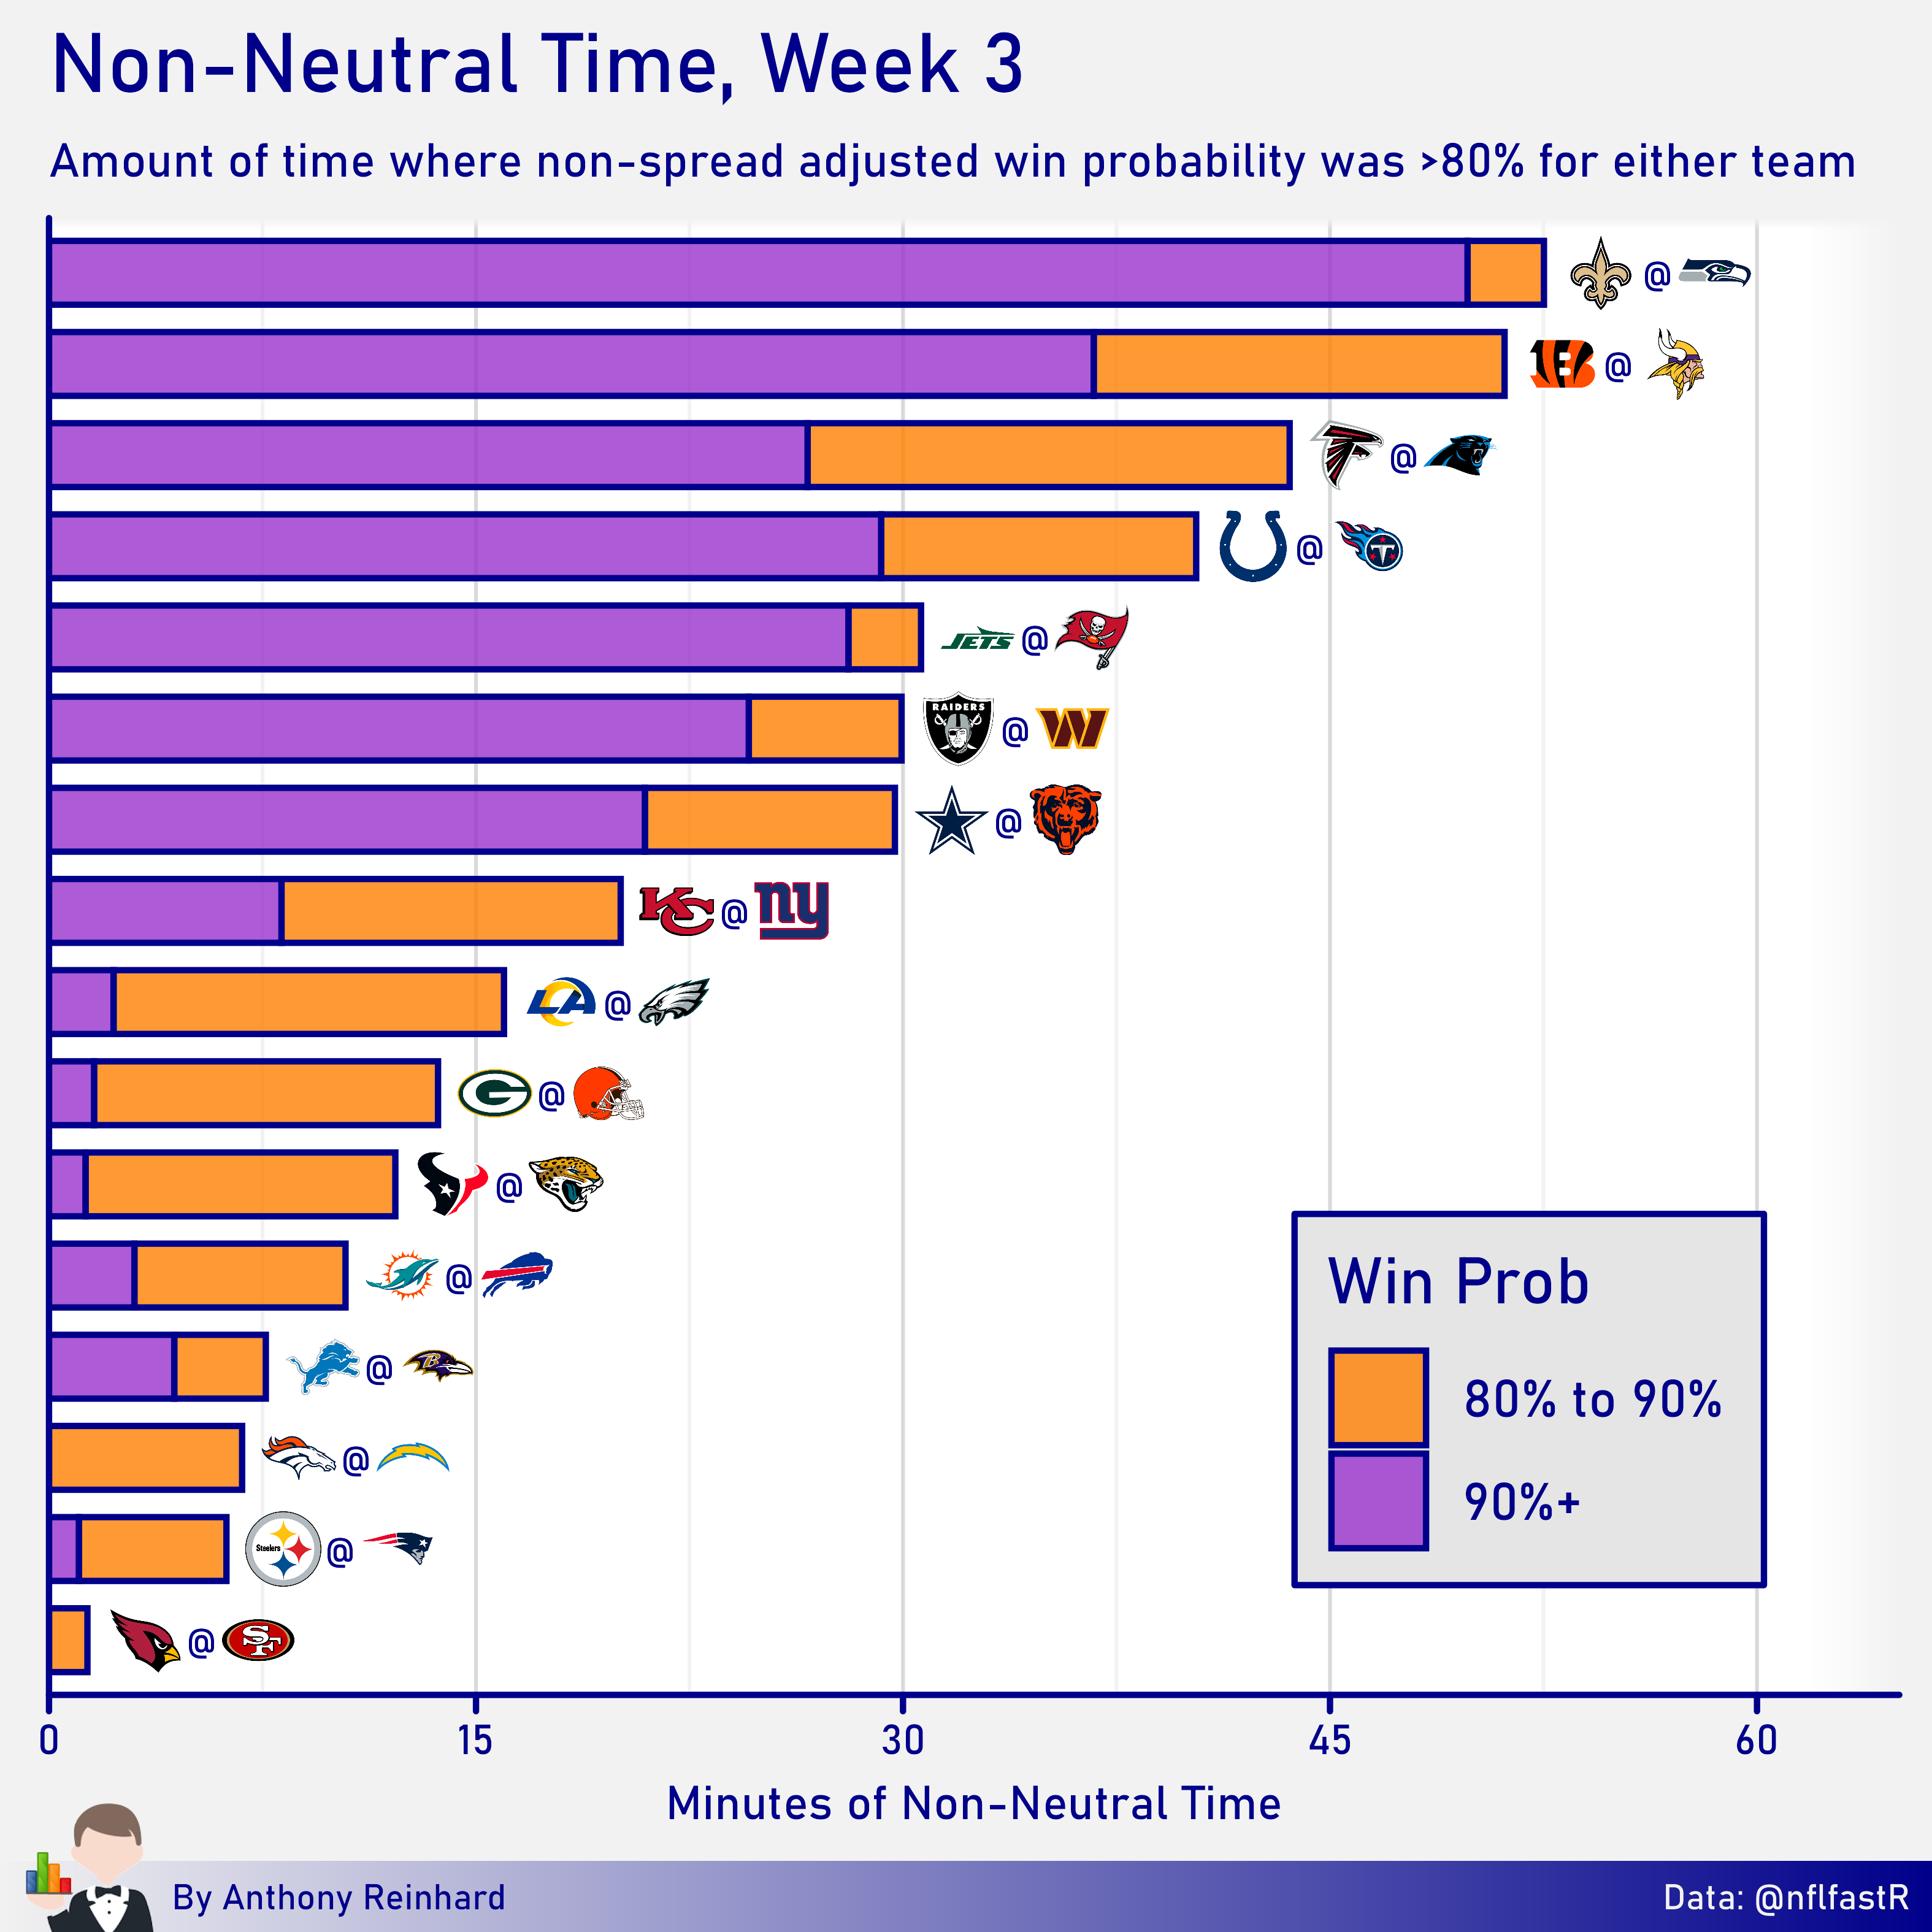
Non-Neutral Time
I’ve been sharing this one for years. Simply gives a sense of how much time each game spent where either team had a high win probability. It can show us huge blowouts (NO-SEA or CIN-MIN), but also where a team wrestles back into the game after mostly playing from behind (NYJ-TB).
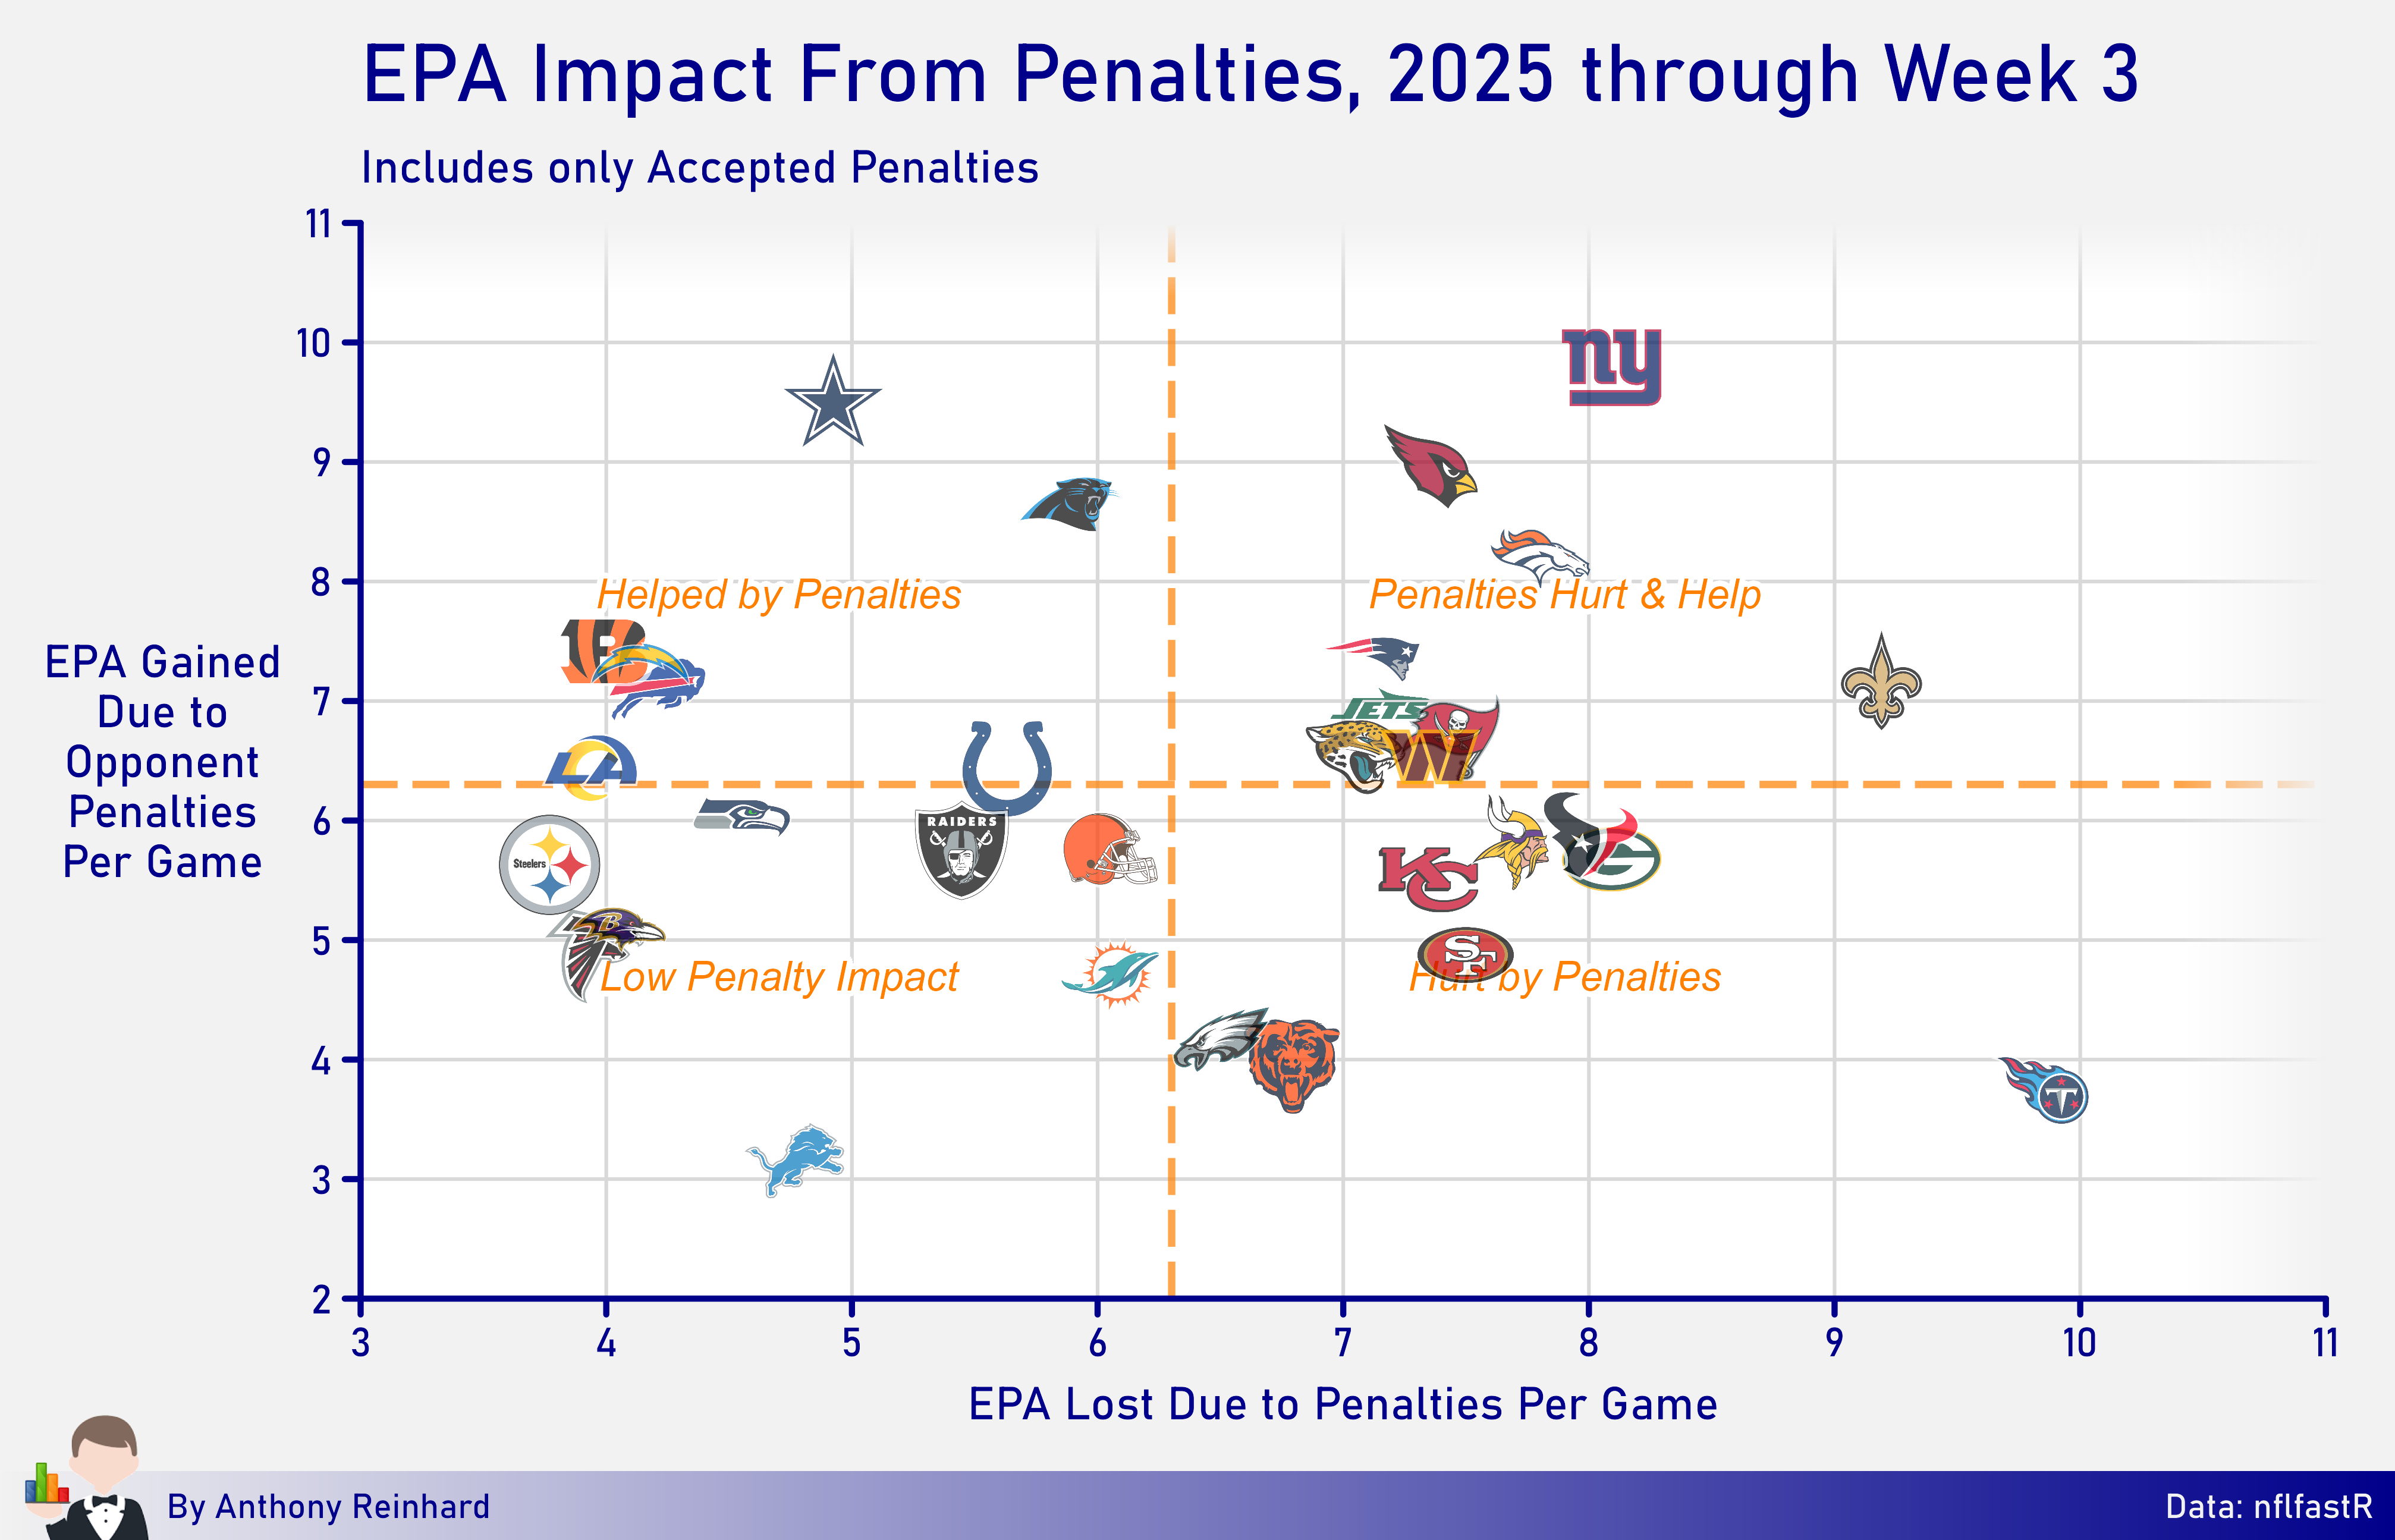
Penalties
This graph shows net Expected Points Added from accepted penalties. The Cowboys are the league’s biggest beneficiaries, while the Titans are giving up nearly a full touchdown per game on flags alone through three games.
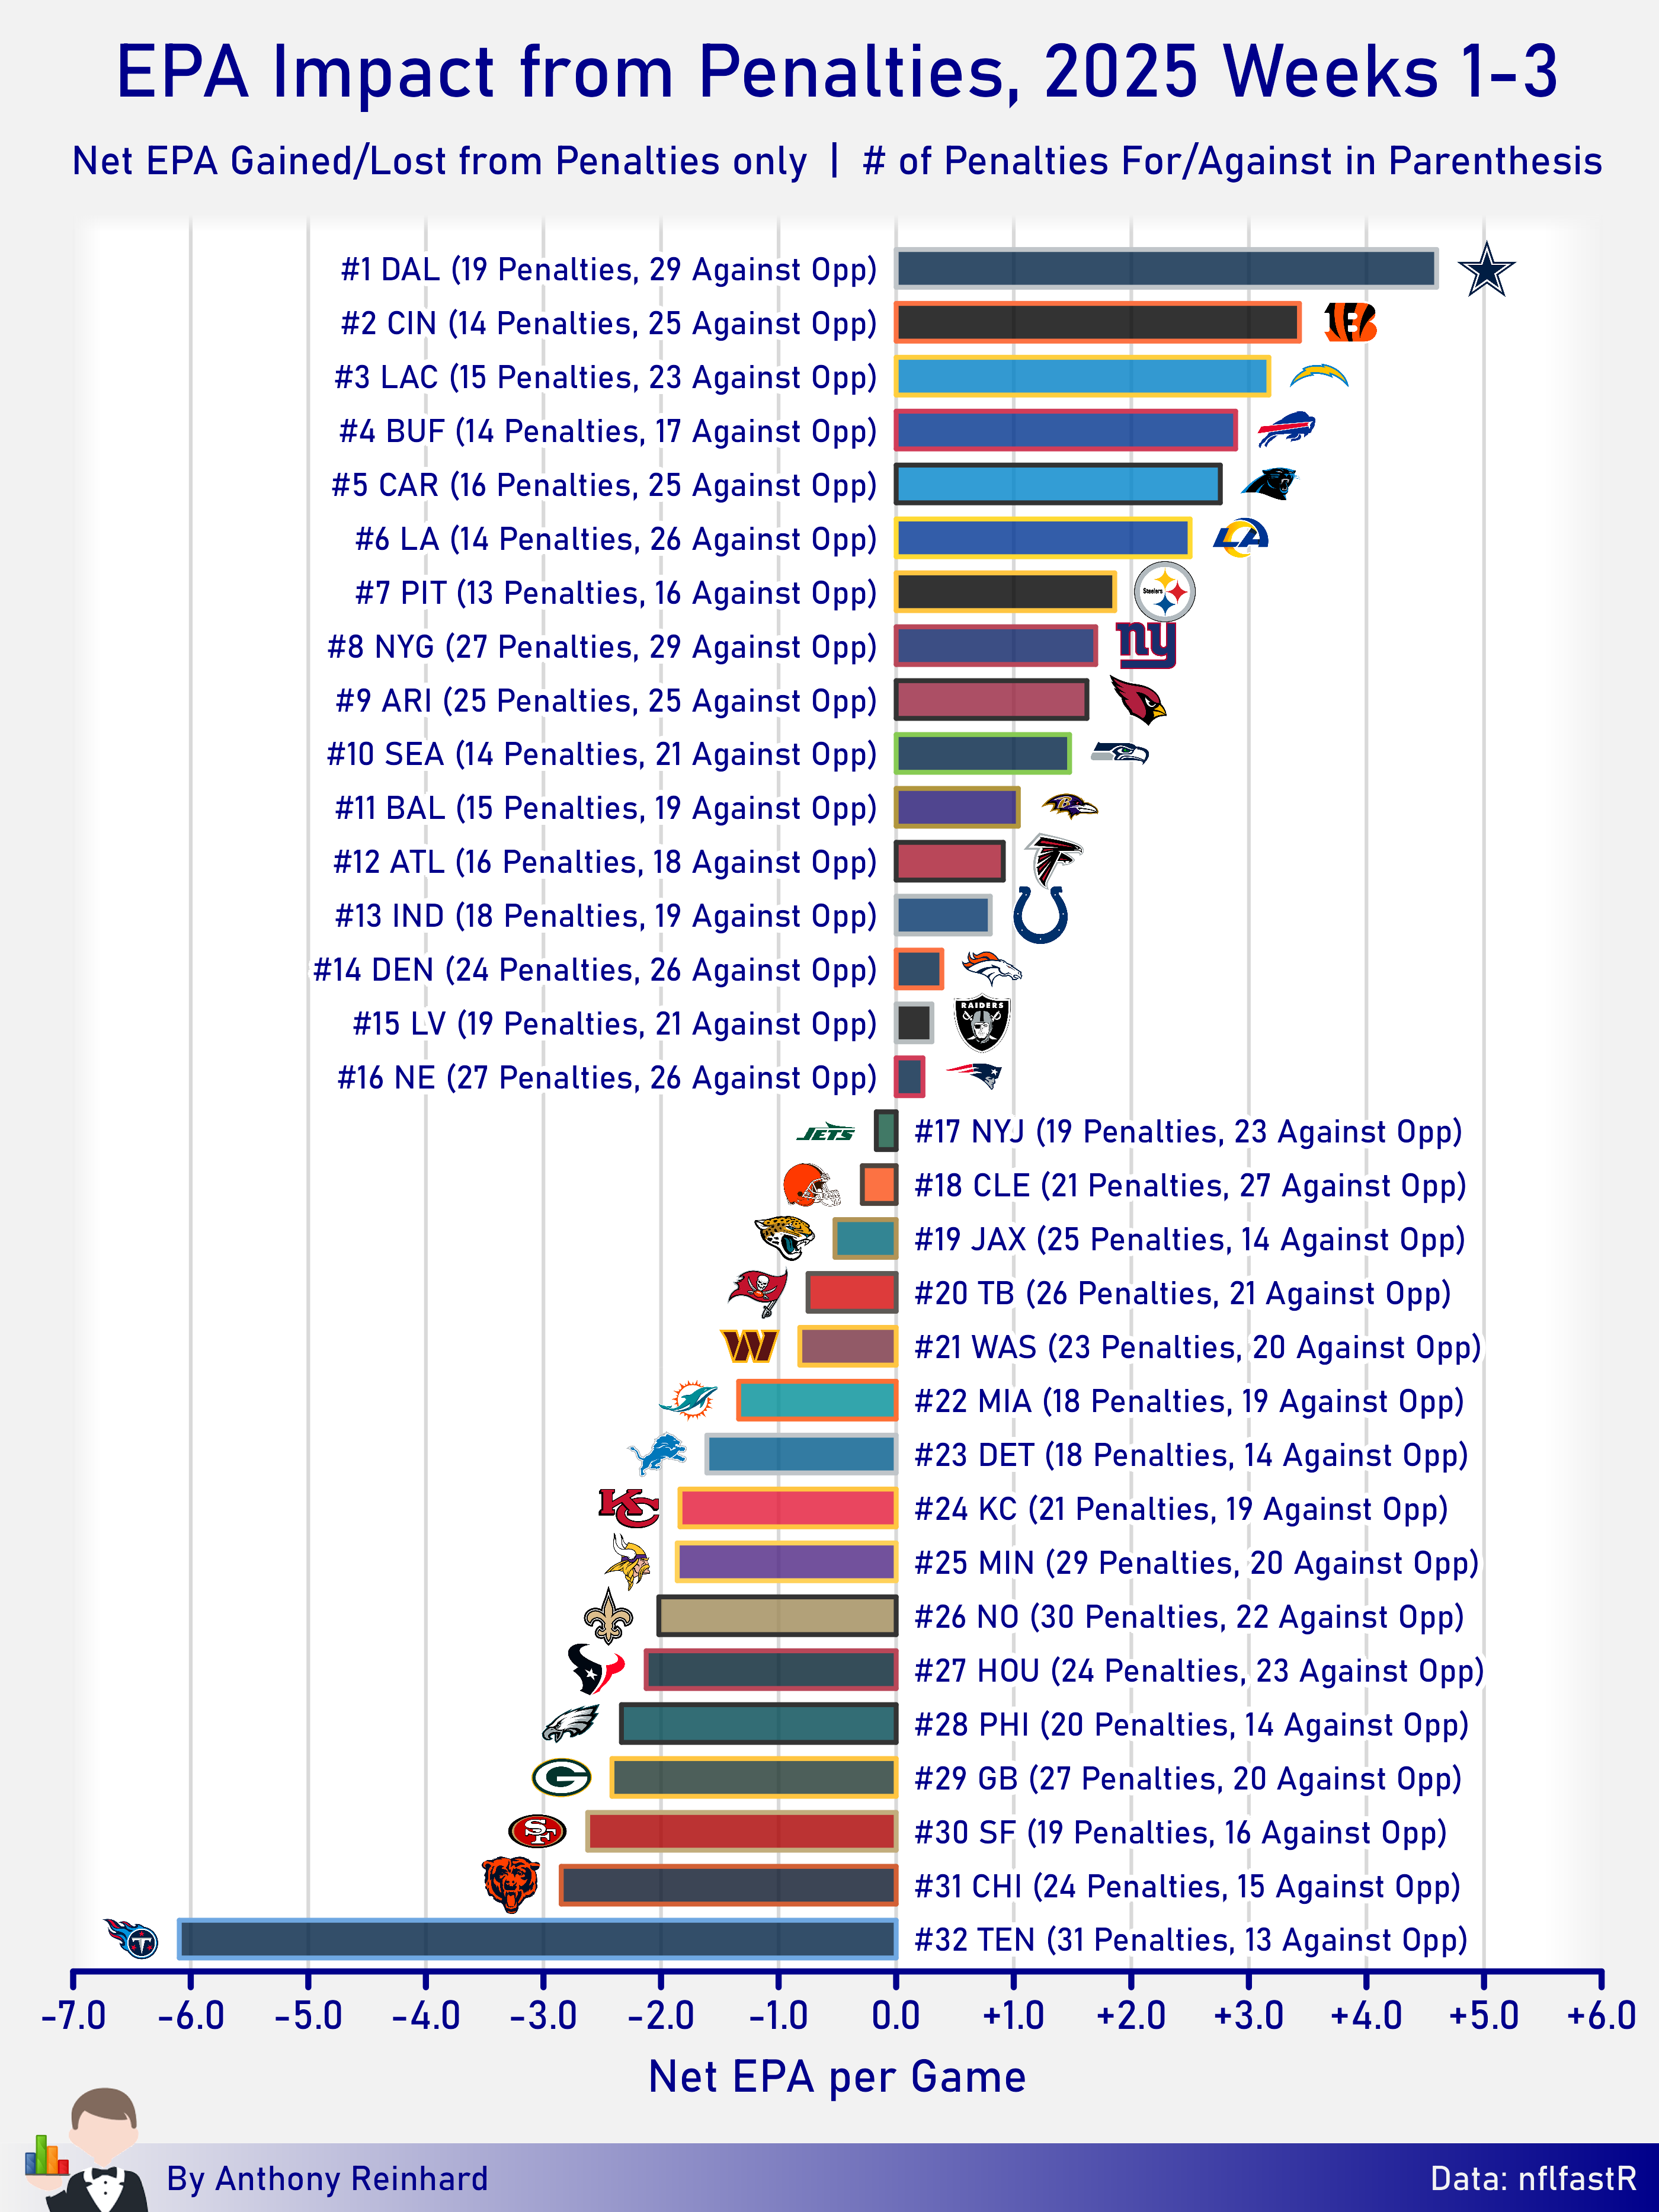
We can see here that the Titans (lower right) have lost more EPA from flags than any other team, while their opponents have lost the second-least EPA from flags.
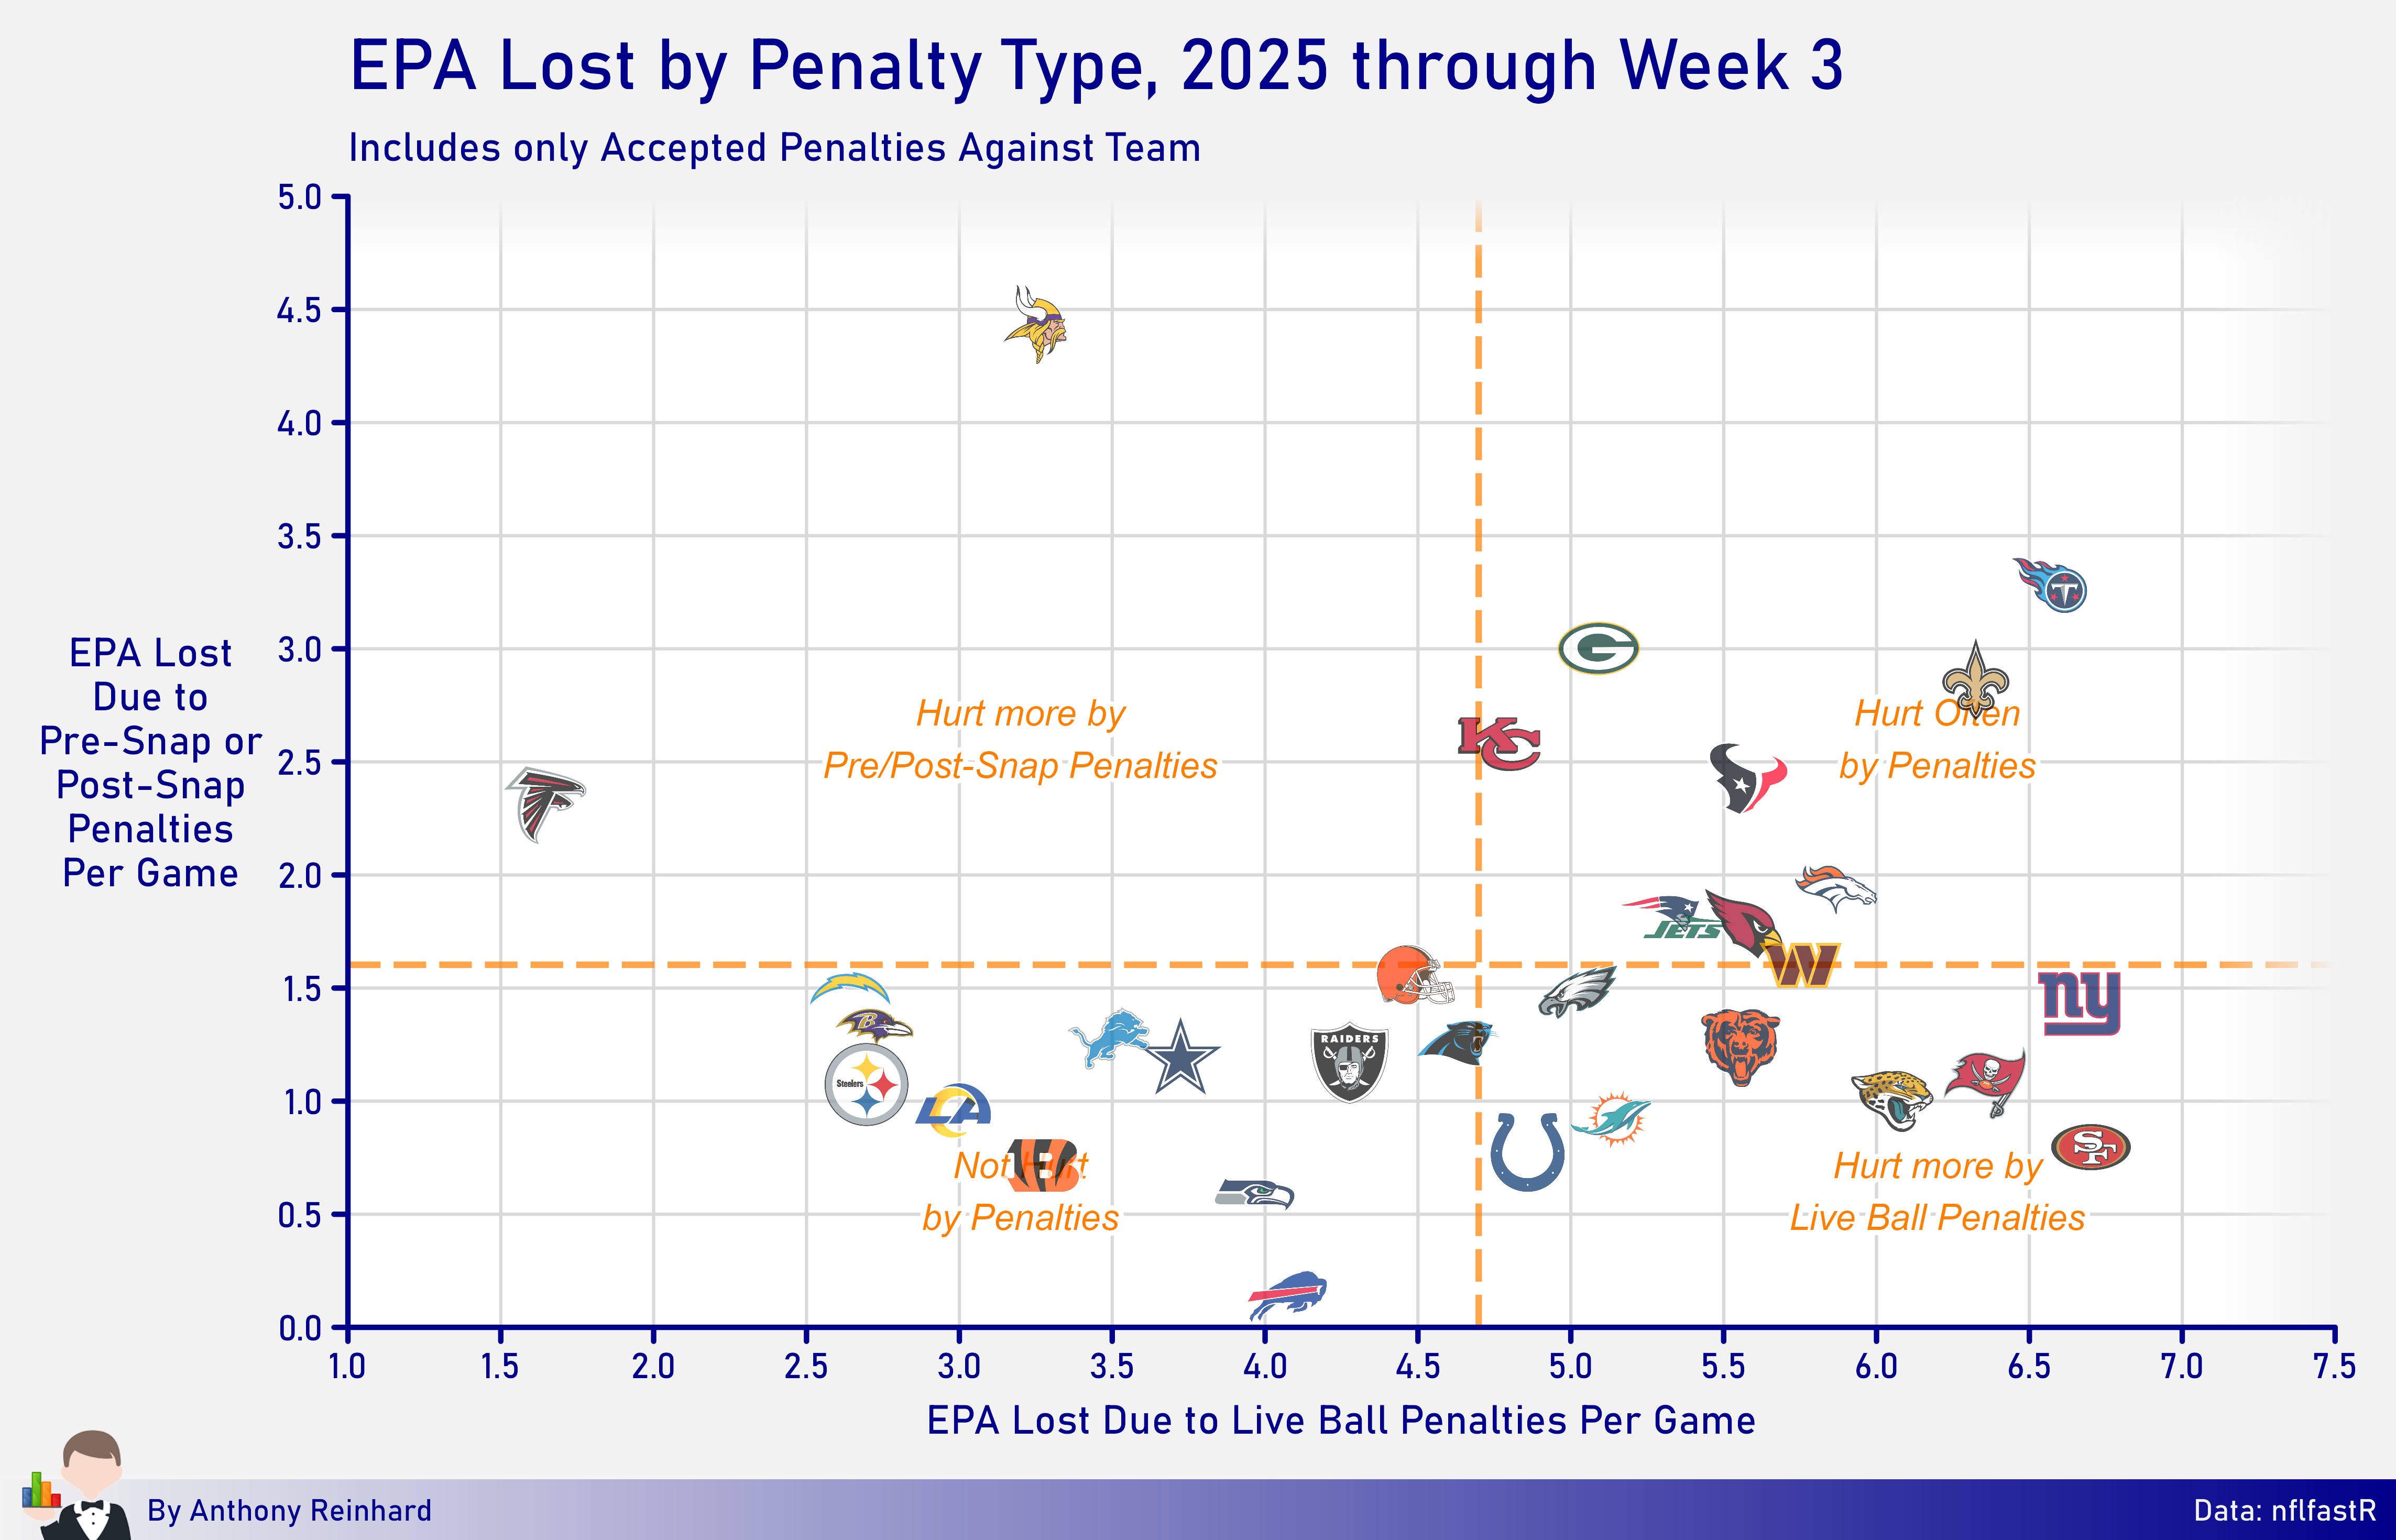
This breaks down penalties by fouls called while the ball was in play versus those called between plays. The Titans, again, are in bad shape on both counts here. The Vikings stick out as a team that have committed expensive pre-snap penalties. Their defense allowed red zone 4th & 1 conversions via penalty in back-to-back weeks, granted both games were mostly decided when those penalties occurred.
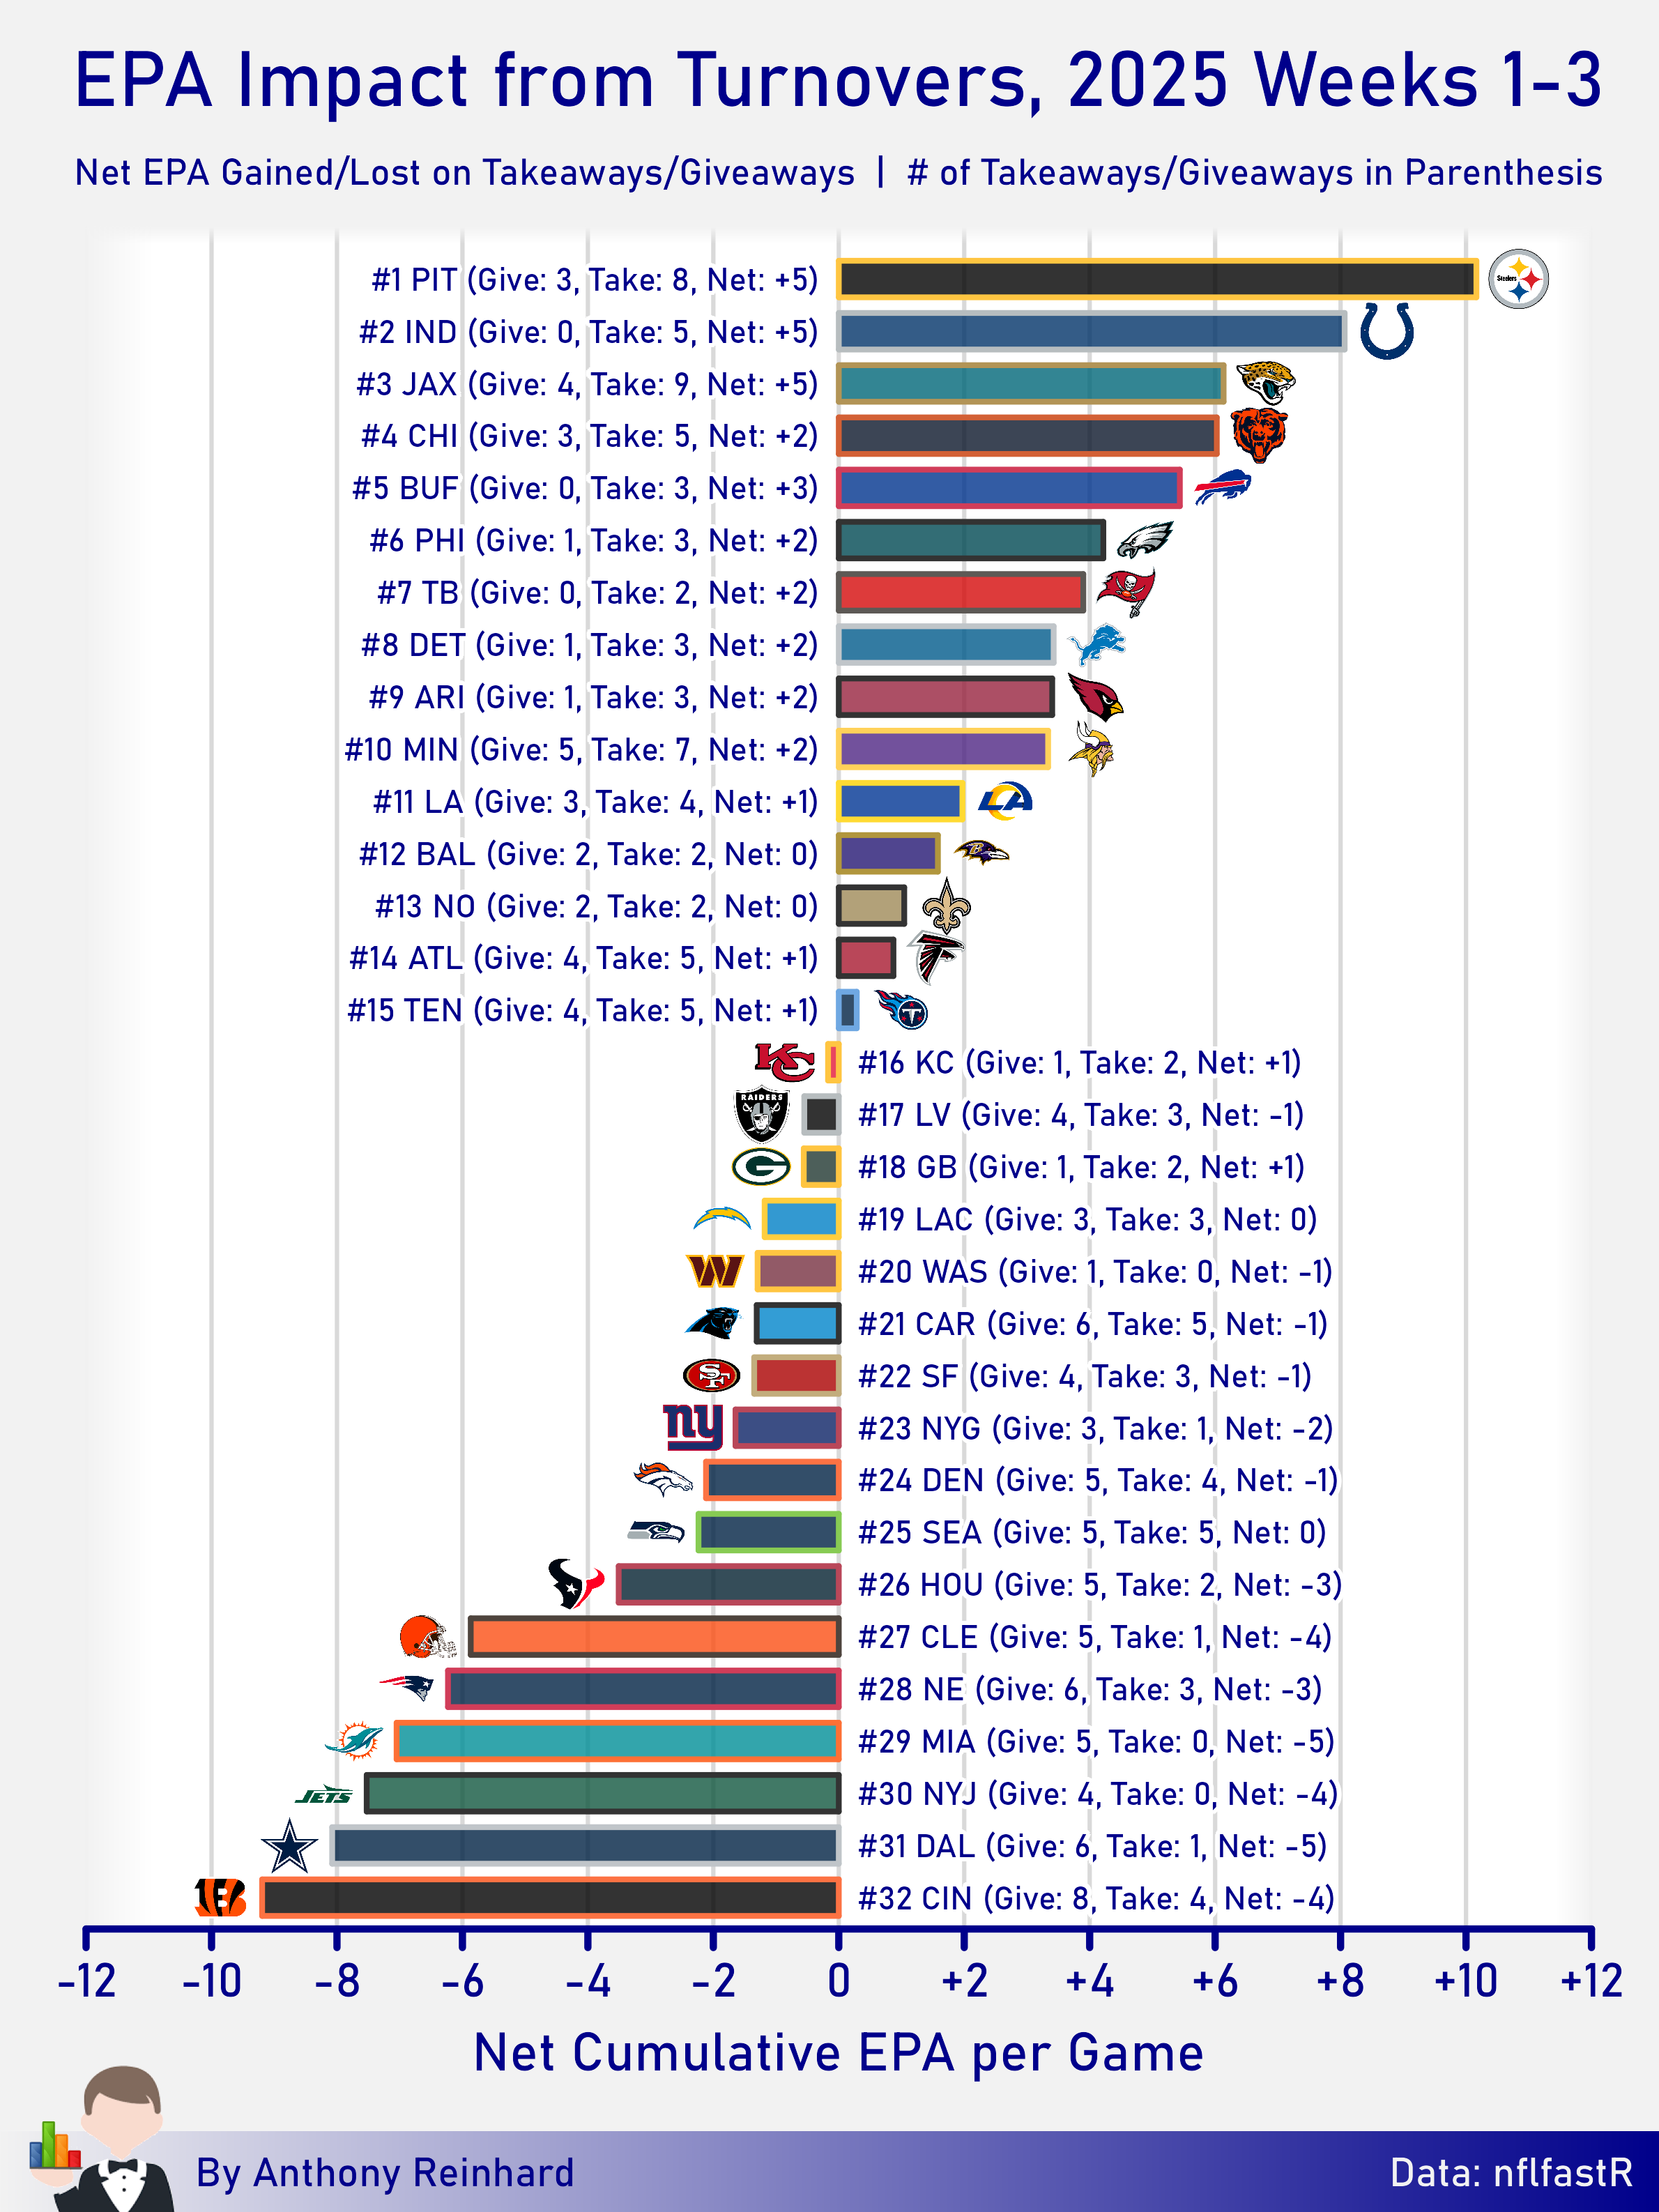
Turnovers
The Bengals were crushed by turnovers in their Week 3 loss in Minnesota in Jake Browning’s first start, giving them the league’s worth EPA turnover differential. The Colts are yet to commit a turnover in the Daniel Jones era.
Looking forward to sharing these graphs throughout the season!