

32 53s: How did the model actually do?
I dig into the performance of my pre-training camp 53-man roster prediction model.

Happy Labor Day! After a vacation last week, I want dive into the performance of my 53-man roster prediction model before shifting into regular season mode. Expect one more post on the model, something in the season preview space for the Browns, and then (hopefully) I’ll have come up with a plan for regular season content. I might try a few different approaches, so please reach out if I share something during the season that speaks to you!
About a week before training camps began in earnest, I released predictions for initial 53-man rosters for all 32 teams. Since I still haven’t heard otherwise, I’m going to call myself the first human on earth to attempt the feat.
Cutdowns arrived on August 26th and teams across the league have trimmed their rosters. As a refresher, I grouped 2,902 players into six categories based on their likelihood of making the initial roster of any NFL team (without consideration of eventual injury/retirement/suspension). Here is how the model performed in the six categories:
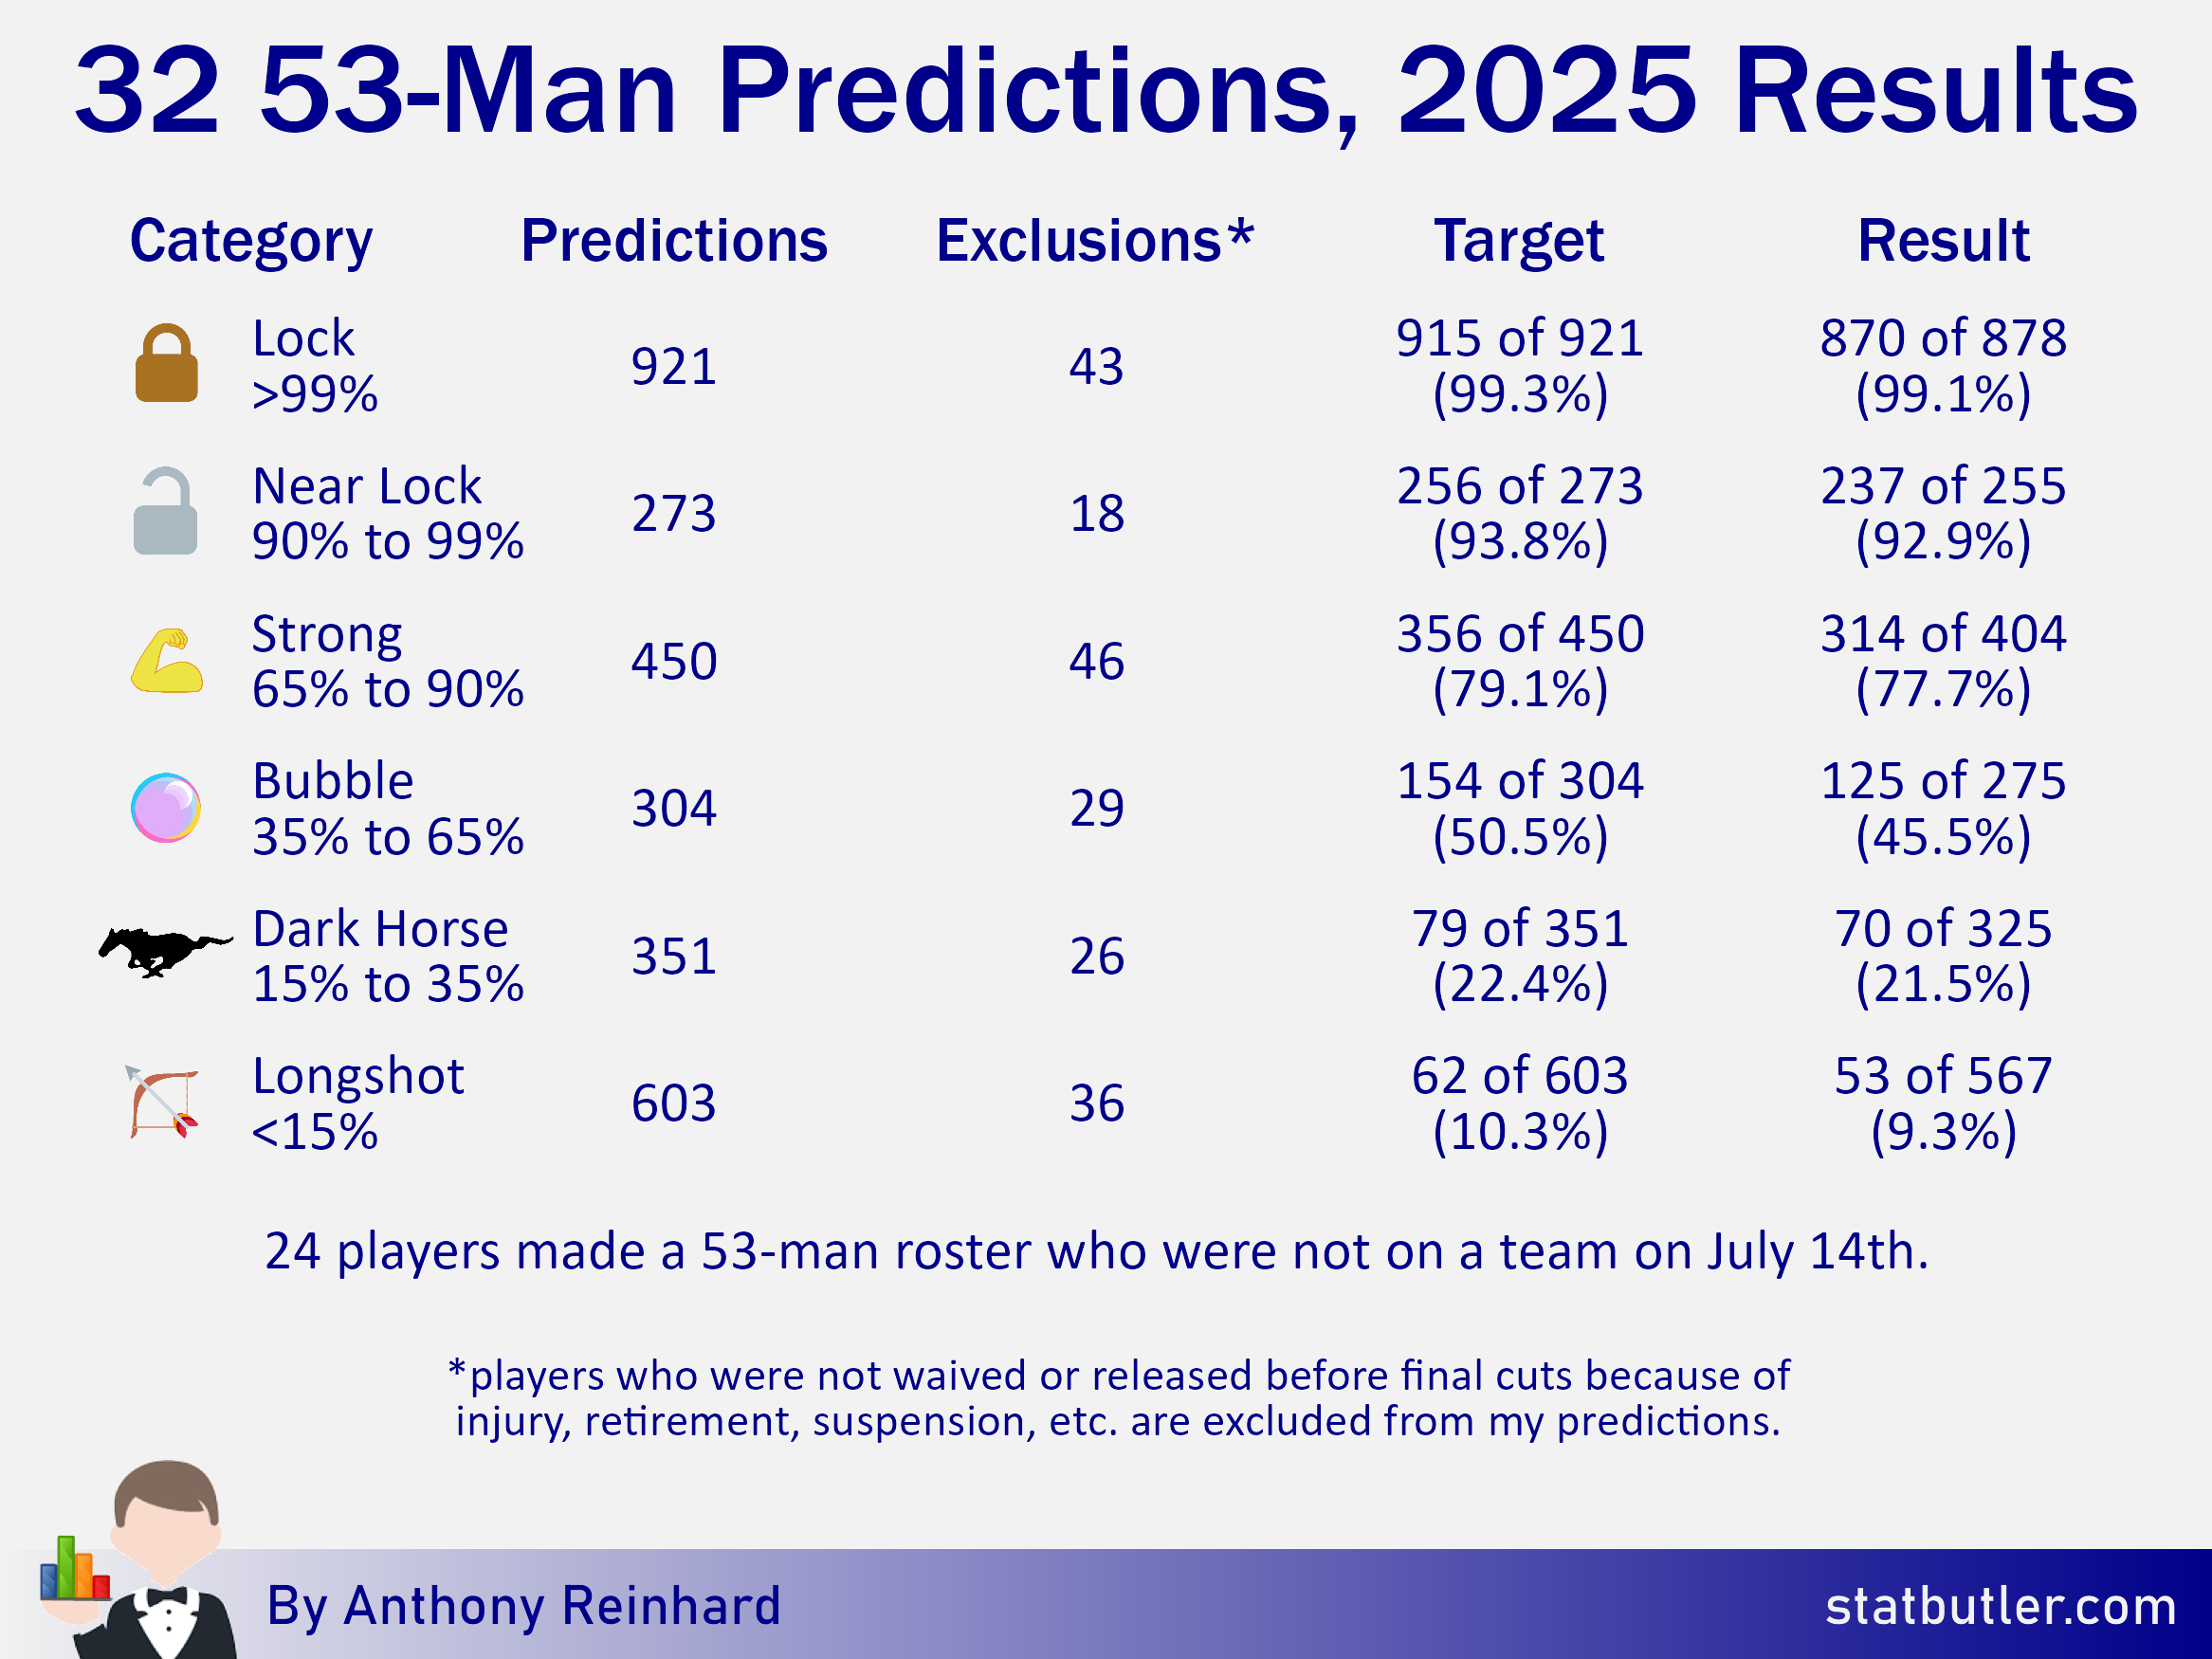
I feel good about these results. While weaknesses were identified with the model (trouble with players coming off injury, inability to properly value specialists, imperfect positional designations, etc.), the model at large was both strong and, in my opinion, informative.
Something that may catch your eye right away is that I overestimated the number of players in every category. I built the model to overload each roster because I’m assuming some players will go down with injuries, but also that there will be some players signed after I make my predictions to take away from that number. In total, I essentially doled out the equivalent an additional 125 net roster spots across the league. In the end, roughly 121 expected spots were vacated due to injuries, retirements, or suspensions, 24 players that made initial rosters were signed after my predictions went out, and the Lions failed to fill three slots on their roster. As a result, my model should have doled out 94 additional roster spots (121 - 24 - 3 = 94), so I overshot by 31 (125 - 94 = 31). It isn’t realistic to be perfect on this, but I should probably tweak the model to be a little closer next time around.
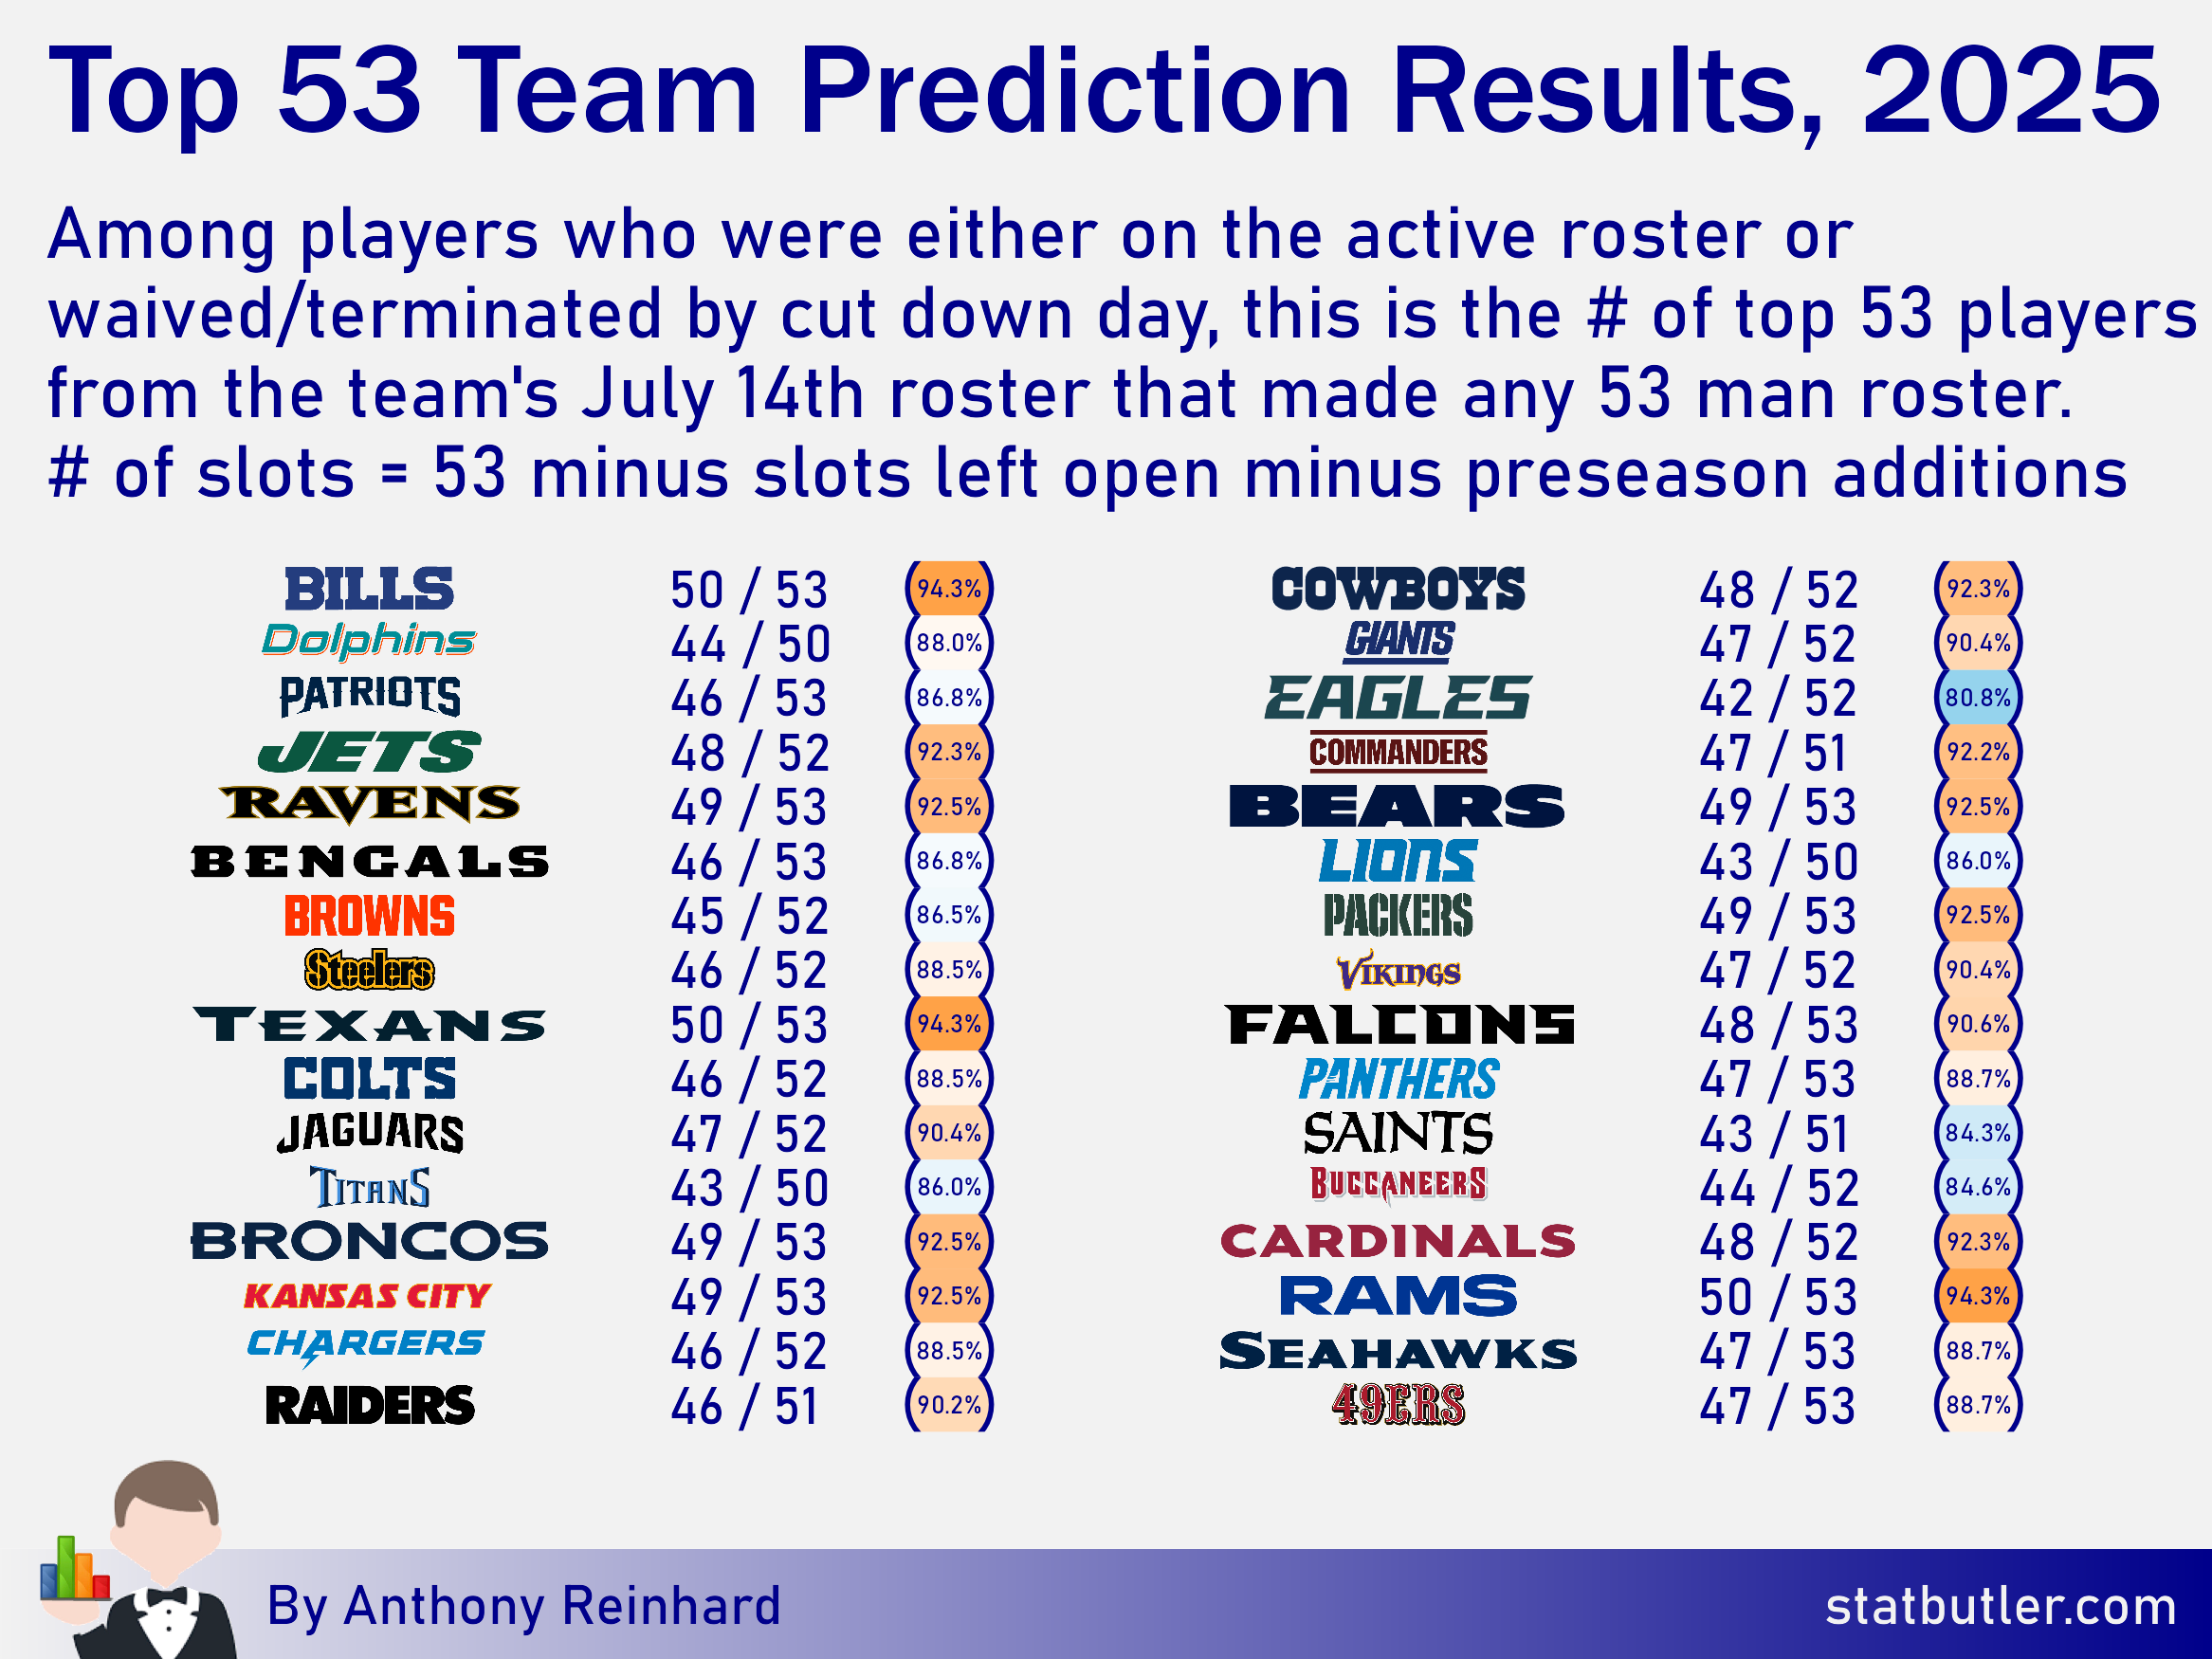
While the point of the model is to be probabilistic in thinking about each player, it is fun to reduce my exercise to the top 53 players. Below, I’ve removed players who eventually retired, were sent to IR, were suspended or otherwise from the predictions my model made on July 14th. From there, I basically determined how close the model was to the top 53 predictions for each team (sorted by highest probability of making the roster, selecting only one of each specialist) all making a roster by cutdowns.
I recognize that my method here is a little confusing so below is an example with the Browns:
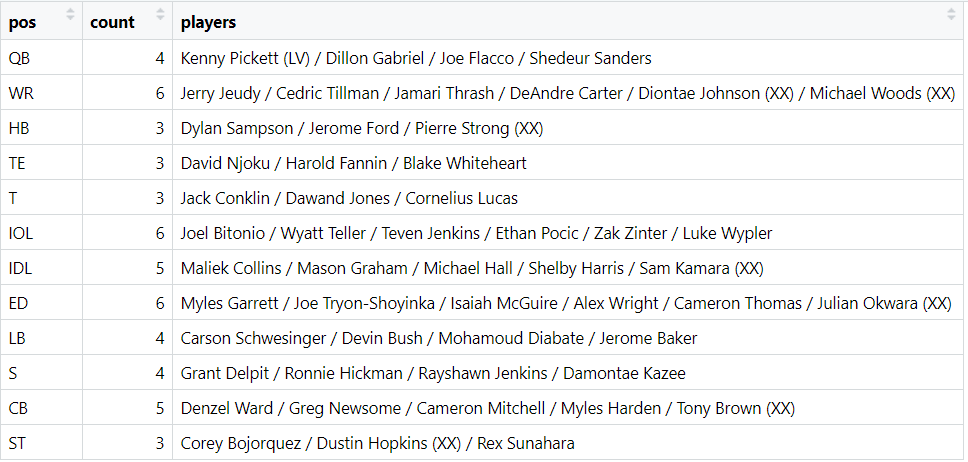
Each of the 52 players listed above were on the Browns roster on July 14th. I’m taking 52 players because Isaiah Bond made the roster after signing late in the preseason and I’m not going to punish for not guessing that he’d exist or give credit for picking him when he wasn’t given a prediction at the outset. The list above ignore players like Jordan Hicks (retired), Deshaun Watson (PUP), Quinshon Judkins (unsigned draft pick), and Martin Emerson (season-ending IR) and instead takes the next highest probability player to give a more complete prediction. Not perfect, but it’s better than ceding more slots. There are 44 players that the model correctly picked to the Browns roster and one more in Kenny Pickett who made the Raiders 53-man roster. Overall, seven players were legit misses for the Browns (see the players with XX following their name).
The results at the team level seem fine, but the true test would be comparing my model to the predictions of others. Early in the preseason, I logged 147 differences between my model and the 32 NFL Nation writers at ESPN. Now that we know how the rosters end up, let’s see how things turned out. Since the writers at ESPN could be working off a different criteria than I am, let’s say that a correct selection is one that selects the correct team on the active 53 on cutdowns and an incorrect selection is a player that is not on any roster for cutdowns. Players who were traded or injured can be considered a push. Under this criteria, I had 69 correct, 56 incorrect, and 22 pushes. The ESPN writers collectively had 70 correct, 63 incorrect, and 14 pushes. Here is a breakdown:
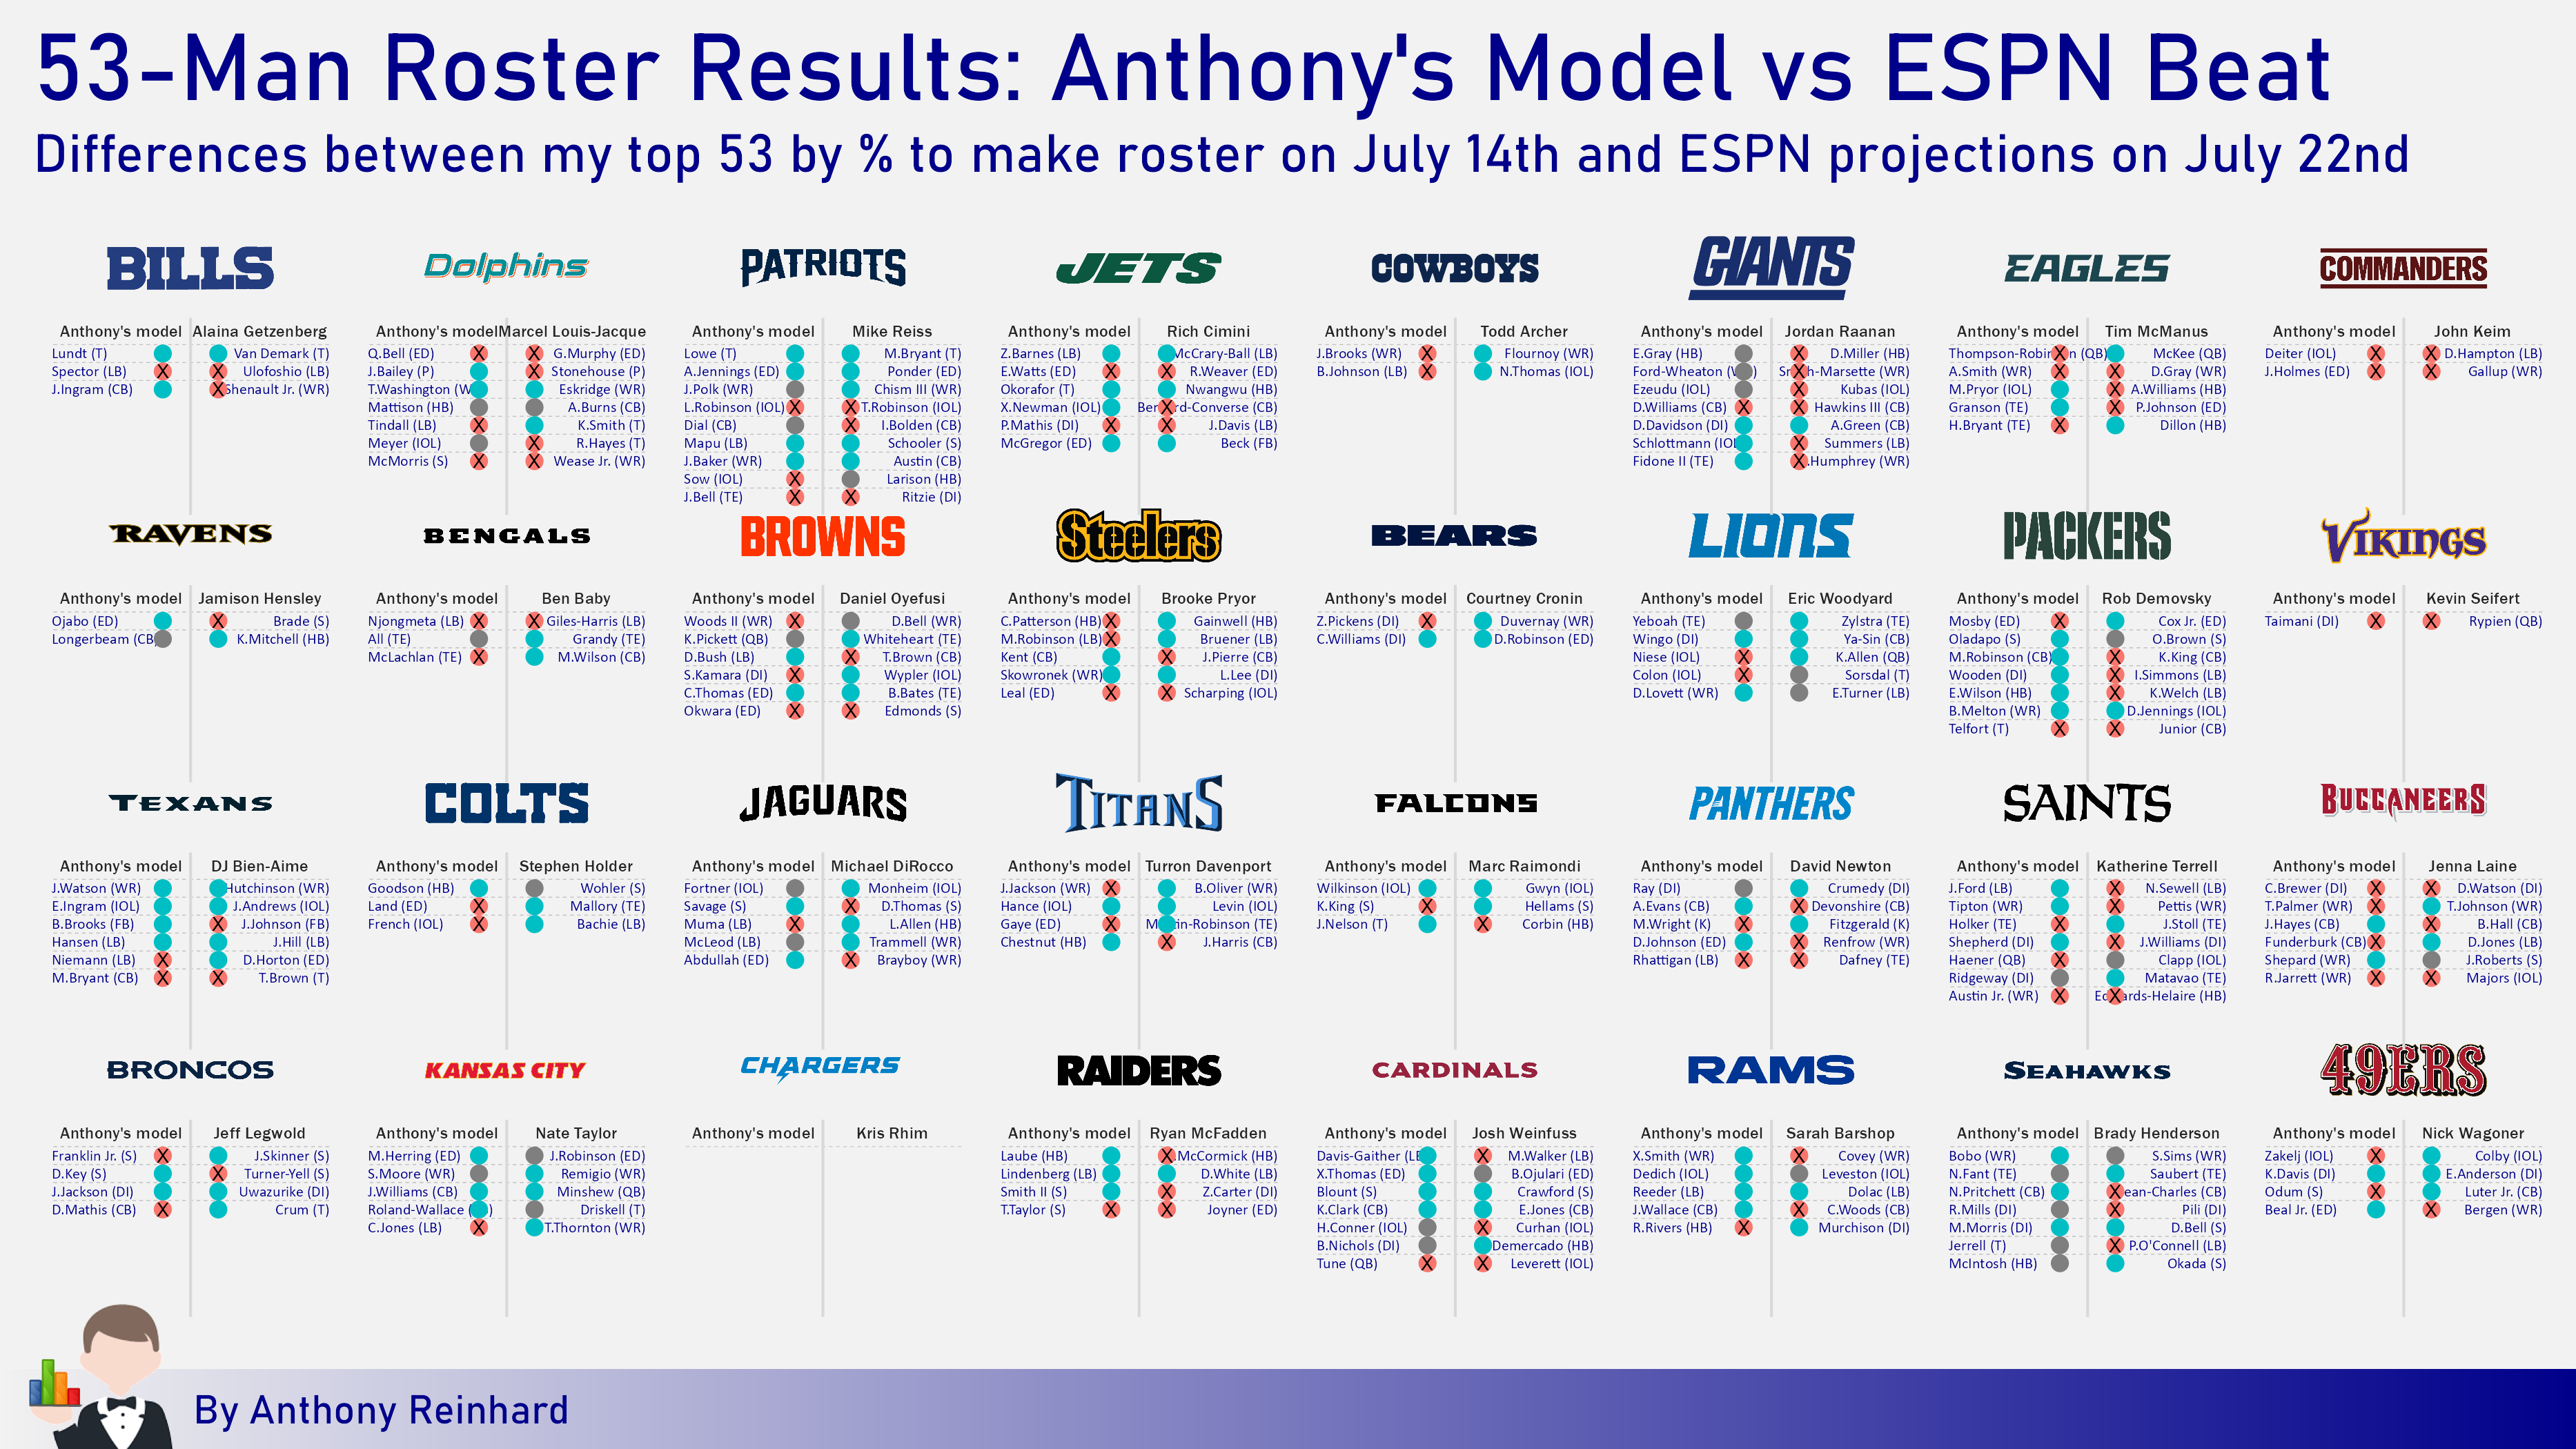
In addition to pulling fairly even on an aggregate basis, my model outperformed 13 beat writers and tied 6 more.
All told, everything here gives me confidence to keep rolling with and expanding on this model for next year. Stay tuned for more!